
Hey guys, in this blog we will see some of the most asked Data Science Interview Questions by interviewers in 2024.
Data science has become an integral part of many industries, and as a result, the demand for skilled data scientists is soaring. To land a coveted data science role, you must excel in the interview process, which often includes a series of challenging questions to assess your technical skills, problem-solving abilities, and domain knowledge. In this article, we will explore some common data science interview questions that will help you prepare and increase your chances of success.
Data Science Interview Questions for Freshers
1. What is Data Science?
An interdisciplinary field that constitutes various scientific processes, algorithms, tools, and machine learning techniques working to help find common patterns and gather sensible insights from the given raw input data using statistical and mathematical analysis is called Data Science.
The following figure represents the life cycle of data science.
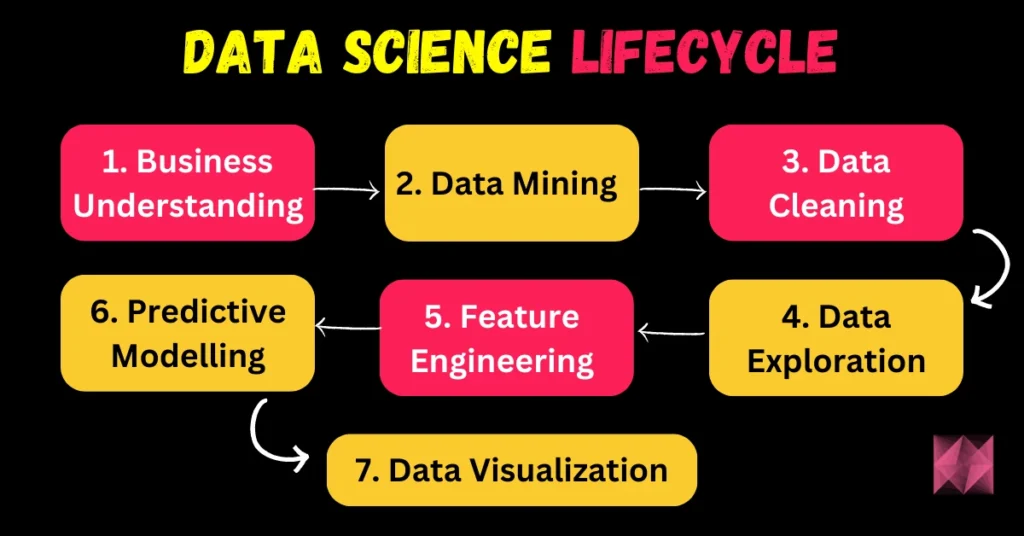
- It starts with gathering the business requirements and relevant data.
- Once the data is acquired, it is maintained by performing data cleaning, data warehousing, data staging, and data architecture.
- Data processing does the task of exploring the data, mining it, and analyzing it which can be finally used to generate the summary of the insights extracted from the data.
- Once the exploratory steps are completed, the cleansed data is subjected to various algorithms like predictive analysis, regression, text mining, recognition patterns, etc depending on the requirements.
- In the final stage, the results are communicated to the business in a visually appealing manner. This is where the skill of data visualization, reporting, and different business intelligence tools come into the picture.
2. What is the difference between data analytics and data science?
- Data science involves the task of transforming data by using various technical analysis methods to extract meaningful insights using which a data analyst can apply to their business scenarios.
- Data analytics deals with checking the existing hypothesis and information and answering questions for a better and more effective business-related decision-making process.
- Data Science drives innovation by answering questions that build connections and answers for futuristic problems. Data analytics focuses on getting present meaning from existing historical context whereas data science focuses on predictive modeling.
- Data Science can be considered as a broad subject that makes use of various mathematical and scientific tools and algorithms for solving complex problems whereas data analytics can be considered as a specific field dealing with specific concentrated problems using fewer tools of statistics and visualization.
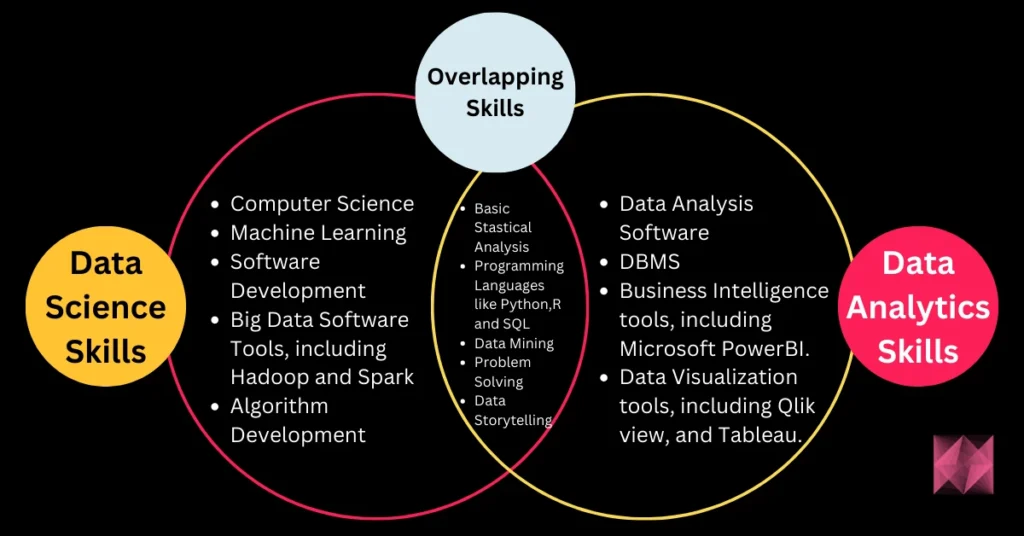
The following Venn diagram depicts the difference between data science and data analytics clearly:
3. What are some of the techniques used for sampling? What is the main advantage of sampling?
Data analysis can not be done on a whole volume of data at a time especially when it involves larger datasets. It becomes crucial to take some data samples that can be used for representing the whole population and then perform analysis on it. While doing this, it is very much necessary to carefully take sample data out of the huge data that truly represents the entire dataset.
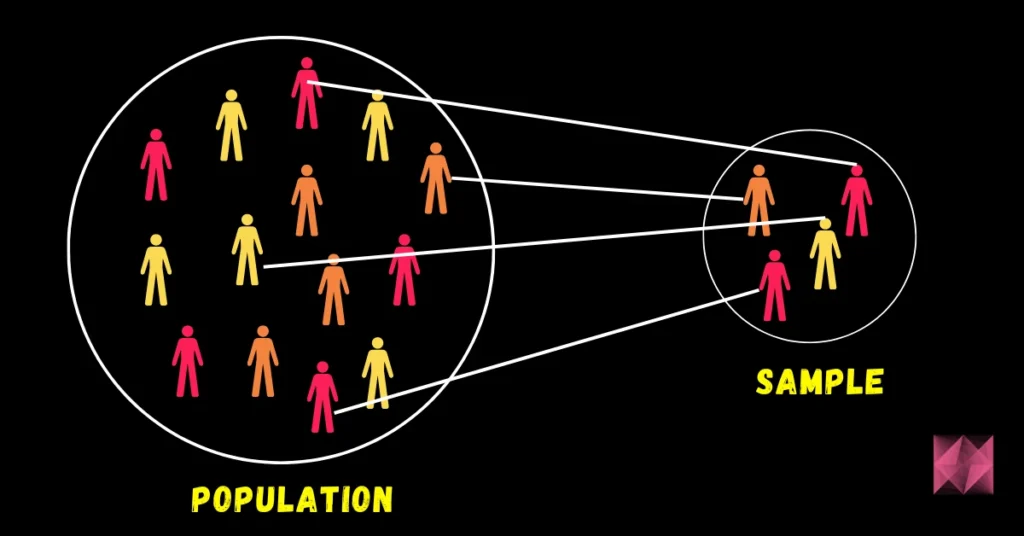
There are majorly two categories of sampling techniques based on the usage of statistics, they are:
- Probability Sampling techniques: Clustered sampling, Simple random sampling, and Stratified sampling.
- Non-Probability Sampling Techniques: Quota sampling, Convenience sampling, snowball sampling, etc.
4. List down the conditions for Overfitting and Underfitting.
Overfitting: The model performs well only for the sample training data. If any new data is given as input to the model, it fails to provide any result. These conditions occur due to low bias and high variance in the model. Decision trees are more prone to overfitting.
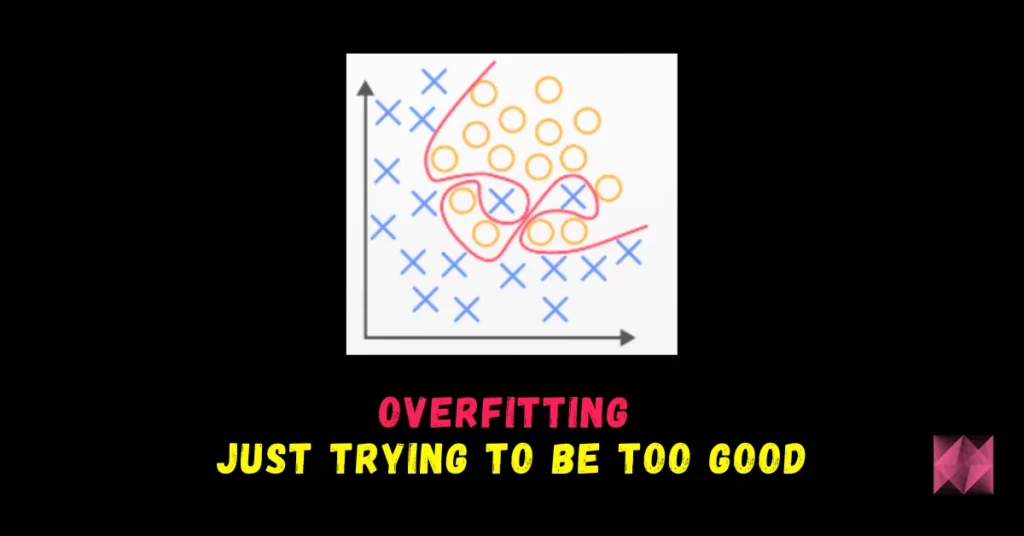
Underfitting: Here, the model is so simple that it is not able to identify the correct relationship in the data, and hence it does not perform well even on the test data. This can happen due to high bias and low variance. Linear regression is more prone to Underfitting.
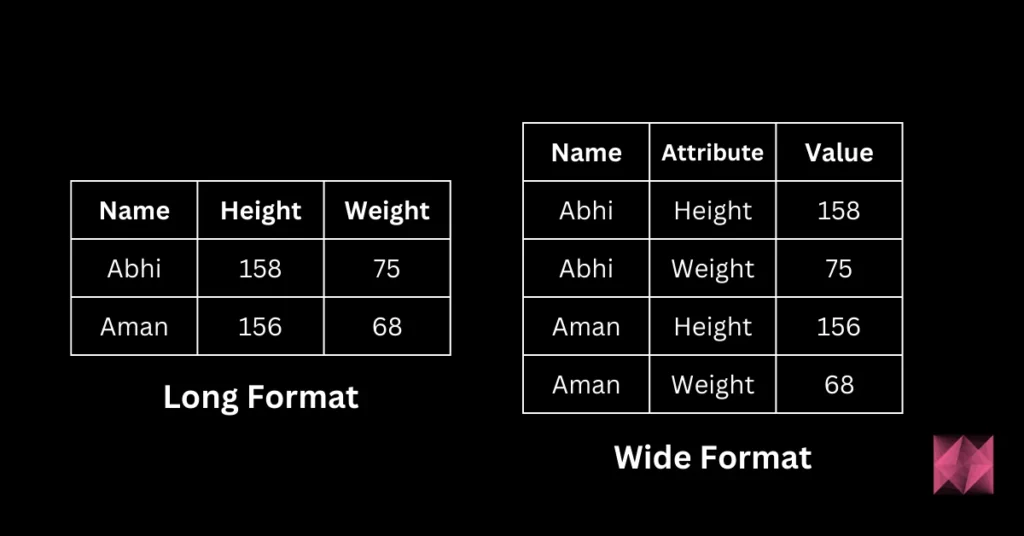
5. Differentiate between the long and wide format data.
| Long format Data | Wide-Format Data |
|---|---|
| Here, each row of the data represents the one-time information of a subject. Each subject would have its data in different/ multiple rows. | Here, the repeated responses of a subject are part of separate columns. |
| The data can be recognized by considering rows as groups. | The data can be recognized by considering columns as groups. |
| This data format is most commonly used in R analyses and to write into log files after each trial. | This data format is rarely used in R analyses and most commonly used in stats packages for repeated measures ANOVAs. |
The following image depicts the representation of wide-format and long-format data:
6. What are Eigenvectors and Eigenvalues?
Eigenvectors are column vectors or unit vectors whose length/magnitude is equal to 1. They are also called right vectors. Eigenvalues are coefficients that are applied on eigenvectors which give these vectors different values for length or magnitude.
A matrix can be decomposed into Eigenvectors and Eigenvalues and this process is called Eigen decomposition. These are then eventually used in machine learning methods like PCA (Principal Component Analysis) for gathering valuable insights from the given matrix.
7. What does it mean when the p-values are high and low?
A p-value is the measure of the probability of having results equal to or more than the results achieved under a specific hypothesis assuming that the null hypothesis is correct. This represents the probability that the observed difference occurred randomly by chance.
- Low p-value which means values ≤ 0.05 means that the null hypothesis can be rejected and the data is unlikely with true null.
- High p-value, i.e values ≥ 0.05 indicates the strength in favor of the null hypothesis. It means that the data is like with true null.
- p-value = 0.05 means that the hypothesis can go either way.
8. When is resampling done?
Resampling is a methodology used to sample data for improving accuracy and quantify the uncertainty of population parameters. It is done to ensure the model is good enough by training the model on different patterns of a dataset to ensure variations are handled. It is also done in the cases where models need to be validated using random subsets or when substituting labels on data points while performing tests.
9. What do you understand by Imbalanced Data?
Data is said to be highly imbalanced if it is distributed unequally across different categories. These datasets result in an error in model performance and result in inaccuracy.
10. Are there any differences between the expected value and the mean value?
There are not many differences between these two, but it is to be noted that these are used in different contexts. The mean value generally refers to the probability distribution whereas the expected value is referred to in the contexts involving random variables.
11. What do you understand by Survivorship Bias?
This bias refers to the logical error while focusing on aspects that survived some process and overlooking those that did not work due to lack of prominence. This bias can lead to deriving wrong conclusions.
12. Define the terms KPI, lift, model fitting, robustness, and DOE.
- KPI: KPI stands for Key Performance Indicator which measures how well the business achieves its objectives.
- Lift: This is a performance measure of the target model measured against a random choice model. Lift indicates how good the model is at prediction versus if there was no model.
- Model fitting: This indicates how well the model under consideration fits given observations.
- Robustness: This represents the system’s capability to handle differences and variances effectively.
- DOE: stands for the design of experiments, which represents the task design aiming to describe and explain information variation under hypothesized conditions to reflect variables.
13. Define confounding variables.
Confounding variables are also known as confounders. These variables are a type of extraneous variables that influence both independent and dependent variables causing spurious association and mathematical relationships between those variables that are associated but are not casually related to each other.
14. Define and explain selection bias?
The selection bias occurs in the case when the researcher has to make a decision on which participant to study. The selection bias is associated with those researches when the participant selection is not random. The selection bias is also called the selection effect. The selection bias is caused by as a result of the method of sample collection.
Four types of selection bias are explained below:
- Sampling Bias: As a result of a population that is not random at all, some members of a population have fewer chances of getting included than others, resulting in a biased sample. This causes a systematic error known as sampling bias.
- Time interval: Trials may be stopped early if we reach any extreme value but if all variables are similar invariance, the variables with the highest variance have a higher chance of achieving the extreme value.
- Data: It is when specific data is selected arbitrarily and the generally agreed criteria are not followed.
- Attrition: Attrition in this context means the loss of the participants. It is the discounting of those subjects that did not complete the trial.
15. Define bias-variance trade-off?
Let us first understand the meaning of bias and variance in detail:
Bias: It is a kind of error in a machine learning model when an ML Algorithm is oversimplified. When a model is trained, at that time it makes simplified assumptions so that it can easily understand the target function. Some algorithms that have low bias are Decision Trees, SVM, etc. On the other hand, logistic and linear regression algorithms are the ones with a high bias.
Variance: Variance is also a kind of error. It is introduced into an ML Model when an ML algorithm is made highly complex. This model also learns noise from the data set that is meant for training. It further performs badly on the test data set. This may lead to over lifting as well as high sensitivity.
When the complexity of a model is increased, a reduction in the error is seen. This is caused by the lower bias in the model. But, this does not happen always till we reach a particular point called the optimal point. After this point, if we keep on increasing the complexity of the model, it will be over lifted and will suffer from the problem of high variance.
As you can see from the image above, before the optimal point, increasing the complexity of the model reduces the error (bias). However, after the optimal point, we see that the increase in the complexity of the machine learning model increases the variance.
Trade-off Of Bias And Variance: So, as we know that bias and variance, both are errors in machine learning models, it is very essential that any machine learning model has low variance as well as a low bias so that it can achieve good performance.
Let us see some examples. The K-Nearest Neighbor Algorithm is a good example of an algorithm with low bias and high variance. This trade-off can easily be reversed by increasing the k value which in turn results in increasing the number of neighbours. This, in turn, results in increasing the bias and reducing the variance.
Another example can be the algorithm of a support vector machine. This algorithm also has a high variance and obviously, a low bias and we can reverse the trade-off by increasing the value of parameter C. Thus, increasing the C parameter increases the bias and decreases the variance.
So, the trade-off is simple. If we increase the bias, the variance will decrease and vice versa.
16. Define the confusion matrix?
It is a matrix that has 2 rows and 2 columns. It has 4 outputs that a binary classifier provides to it. It is used to derive various measures like specificity, error rate, accuracy, precision, sensitivity, and recall.
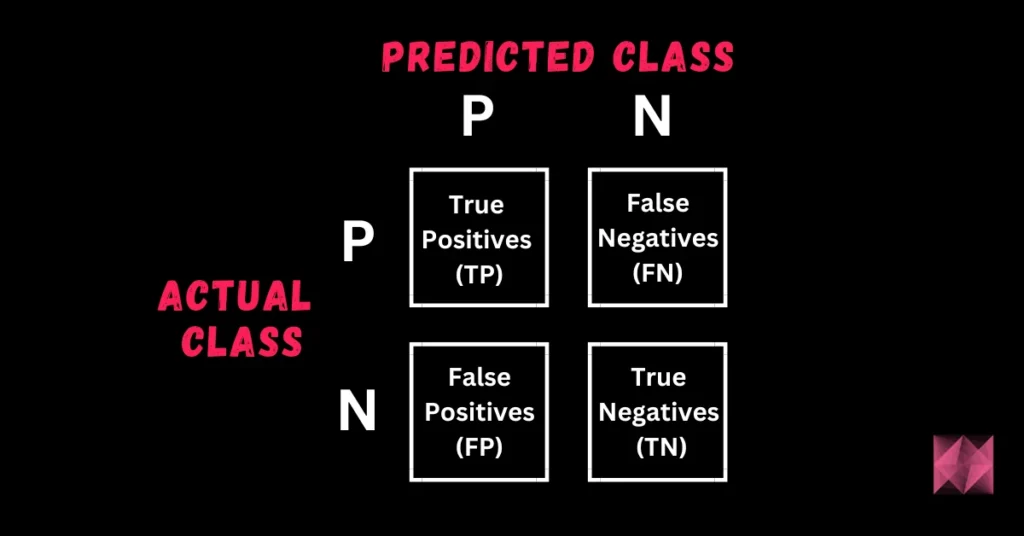
The test data set should contain the correct and predicted labels. The labels depend upon the performance. For instance, the predicted labels are the same if the binary classifier performs perfectly. Also, they match the part of observed labels in real-world scenarios. The four outcomes shown above in the confusion matrix mean the following:
- True Positive: This means that the positive prediction is correct.
- False Positive: This means that the positive prediction is incorrect.
- True Negative: This means that the negative prediction is correct.
- False Negative: This means that the negative prediction is incorrect.
The formulas for calculating basic measures that comes from the confusion matrix are:
- Error rate: (FP + FN)/(P + N)
- Accuracy: (TP + TN)/(P + N)
- Sensitivity = TP/P
- Specificity = TN/N
- Precision = TP/(TP + FP)
- F-Score = (1 + b)(PREC.REC)/(b2 PREC + REC) Here, b is mostly 0.5 or 1 or 2.
In these formulas:
FP = false positive
FN = false negative
TP = true positive
RN = true negative
Also,
Sensitivity is the measure of the True Positive Rate. It is also called recall.
Specificity is the measure of the true negative rate.
Precision is the measure of a positive predicted value.
F-score is the harmonic mean of precision and recall.
17. What is logistic regression? State an example where you have recently used logistic regression.
Logistic Regression is also known as the logit model. It is a technique to predict the binary outcome from a linear combination of variables (called predictor variables).
For example, let us say that we want to predict the outcome of elections for a particular political leader. So, we want to find out whether this leader is going to win the election or not. So, the result is binary i.e. win (1) or loss (0). However, the input is a combination of linear variables like the money spent on advertising, the past work done by the leader and the party, etc.
18. What is Linear Regression? What are some of the major drawbacks of the linear model?
Linear regression is a technique in which the score of a variable Y is predicted using the score of a predictor variable X. Y is called the criterion variable. Some of the drawbacks of Linear Regression are as follows:
- The assumption of linearity of errors is a major drawback.
- It cannot be used for binary outcomes. We have Logistic Regression for that.
- Overfitting problems are there that can’t be solved.
19. What is a random forest? Explain it’s working.
Classification is very important in machine learning. It is very important to know to which class does an observation belongs. Hence, we have various classification algorithms in machine learning like logistic regression, support vector machine, decision trees, Naive Bayes classifier, etc. One such classification technique that is near the top of the classification hierarchy is the random forest classifier.
So, firstly we need to understand a decision tree before we can understand the random forest classifier and its works. So, let us say that we have a string as given below:

So, we have a string with 5 ones and 4 zeroes and we want to classify the characters of this string using their features. These features are color (red or green in this case) and whether the observation (i.e. character) is underlined or not. Now, let us say that we are only interested in red and underlined observations. So, the decision tree would look something like this:
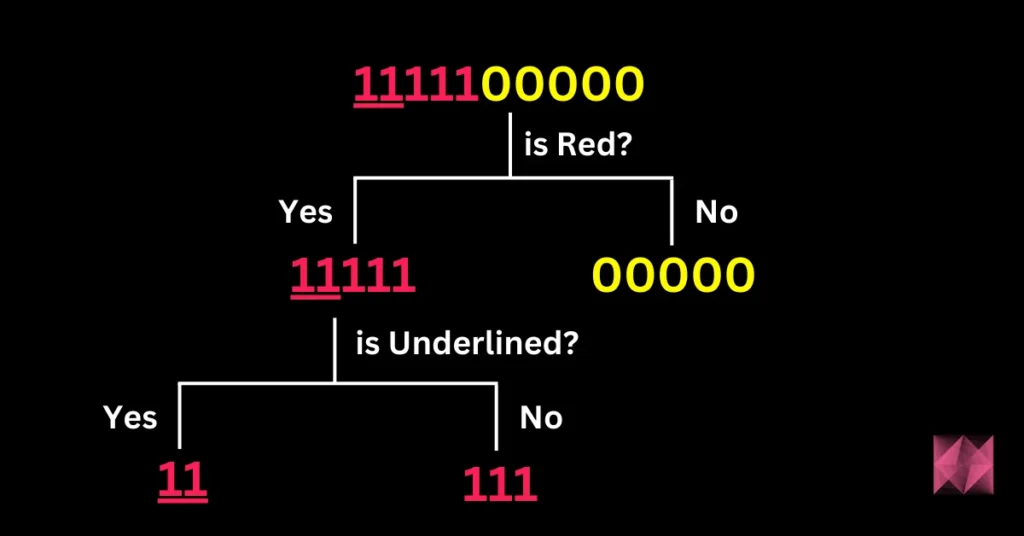
So, we started with the colour first as we are only interested in the red observations and we separated the red and the green-coloured characters. After that, the “No” branch i.e. the branch that had all the green coloured characters was not expanded further as we want only red-underlined characters. So, we expanded the “Yes” branch and we again got a “Yes” and a “No” branch based on the fact whether the characters were underlined or not.
So, this is how we draw a typical decision tree. However, the data in real life is not this clean but this was just to give an idea about the working of the decision trees. Let us now move to the random forest.
Random Forest
It consists of a large number of decision trees that operate as an ensemble. Basically, each tree in the forest gives a class prediction and the one with the maximum number of votes becomes the prediction of our model. For instance, in the example shown below, 4 decision trees predict 1, and 2 predict 0. Hence, prediction 1 will be considered.

The underlying principle of a random forest is that several weak learners combine to form a keen learner. The steps to build a random forest are as follows:
- Build several decision trees on the samples of data and record their predictions.
- Each time a split is considered for a tree, choose a random sample of mm predictors as the split candidates out of all the pp predictors. This happens to every tree in the random forest.
- Apply the rule of thumb i.e. at each split m = p√m = p.
- Apply the predictions to the majority rule.
20. In a time interval of 15 minutes, the probability that you may see a shooting star or a bunch of them is 0.2. What is the percentage chance of you seeing at least one star shooting from the sky if you are under it for about an hour?
Let us say that Prob is the probability that we may see a minimum of one shooting star in 15 minutes.
So, Prob = 0.2
Now, the probability that we may not see any shooting star in the time duration of 15 minutes is = 1 – Prob
1-0.2 = 0.8
The probability that we may not see any shooting star for an hour is:
= (1-Prob)(1-Prob)(1-Prob)*(1-Prob)
= 0.8 * 0.8 * 0.8 * 0.8 = (0.8)⁴
≈ 0.40
So, the probability that we will see one shooting star in the time interval of an hour is = 1-0.4 = 0.6
So, there are approximately 60% chances that we may see a shooting star in the time span of an hour.
21. What is deep learning? What is the difference between deep learning and machine learning?
Deep learning is a paradigm of machine learning. In deep learning, multiple layers of processing are involved in order to extract high features from the data. The neural networks are designed in such a way that they try to simulate the human brain.
Deep learning has shown incredible performance in recent years because of the fact that it shows great analogy with the human brain.
The difference between machine learning and deep learning is that deep learning is a paradigm or a part of machine learning that is inspired by the structure and functions of the human brain called the artificial neural networks.
22. What is a Gradient and Gradient Descent?
Gradient: Gradient is the measure of a property that how much the output has changed with respect to a little change in the input. In other words, we can say that it is a measure of change in the weights with respect to the change in error. The gradient can be mathematically represented as the slope of a function.
Gradient Descent: Gradient descent is a minimization algorithm that minimizes the Activation function. Well, it can minimize any function given to it but it is usually provided with the activation function only.
Gradient descent, as the name suggests means descent or a decrease in something. The analogy of gradient descent is often taken as a person climbing down a hill/mountain. The following is the equation describing what gradient descent means:
So, if a person is climbing down the hill, the next position that the climber has to come to is denoted by “b” in this equation. Then, there is a minus sign because it denotes the minimization (as gradient descent is a minimization algorithm). The Gamma is called a waiting factor and the remaining term which is the Gradient term itself shows the direction of the steepest descent.
This situation can be represented in a graph as follows:
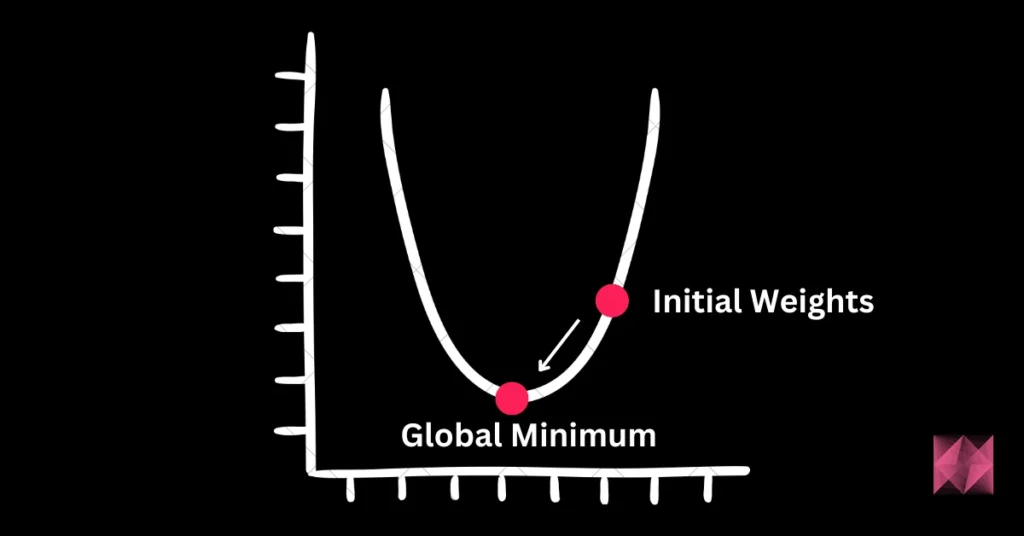
Here, we are somewhere at the “Initial Weights” and we want to reach the Global minimum. So, this minimization algorithm will help us do that.
Data Science Interview Questions for Experienced
23. How are the time series problems different from other regression problems?
- Time series data can be thought of as an extension to linear regression which uses terms like autocorrelation, and movement of averages for summarizing historical data of y-axis variables for predicting a better future.
- Forecasting and prediction is the main goal of time series problems where accurate predictions can be made but sometimes the underlying reasons might not be known.
- Having Time in the problem does not necessarily mean it becomes a time series problem. There should be a relationship between the target and time for a problem to become a time series problem.
- The observations close to one another in time are expected to be similar to the ones far away which provide accountability for seasonality. For instance, today’s weather would be similar to tomorrow’s weather but not similar to weather from 4 months from today. Hence, weather prediction based on past data becomes a time series problem.
24. What are RMSE and MSE in a linear regression model?
RMSE: RMSE stands for Root Mean Square Error. In a linear regression model, RMSE is used to test the performance of the machine learning model. It is used to evaluate the data spread around the line of best fit. So, in simple words, it is used to measure the deviation of the residuals.
RMSE is calculated using the formula:
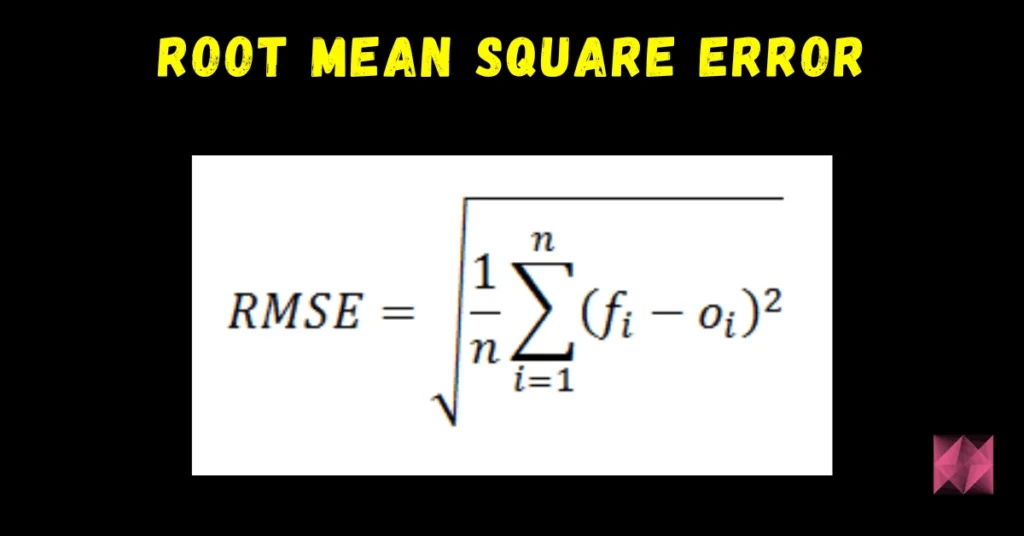
- Yi is the actual value of the output variable.
- Y(Cap) is the predicted value and,
- N is the number of data points.
MSE: Mean Squared Error is used to find how close is the line to the actual data. So, we make the difference in the distance of the data points from the line and the difference is squared. This is done for all the data points and the submission of the squared difference divided by the total number of data points gives us the Mean Squared Error (MSE).
So, if we are taking the squared difference of N data points and dividing the sum by N, what does it mean? Yes, it represents the average of the squared difference of a data point from the line i.e. the average of the squared difference between the actual and the predicted values. The formula for finding MSE is given below:
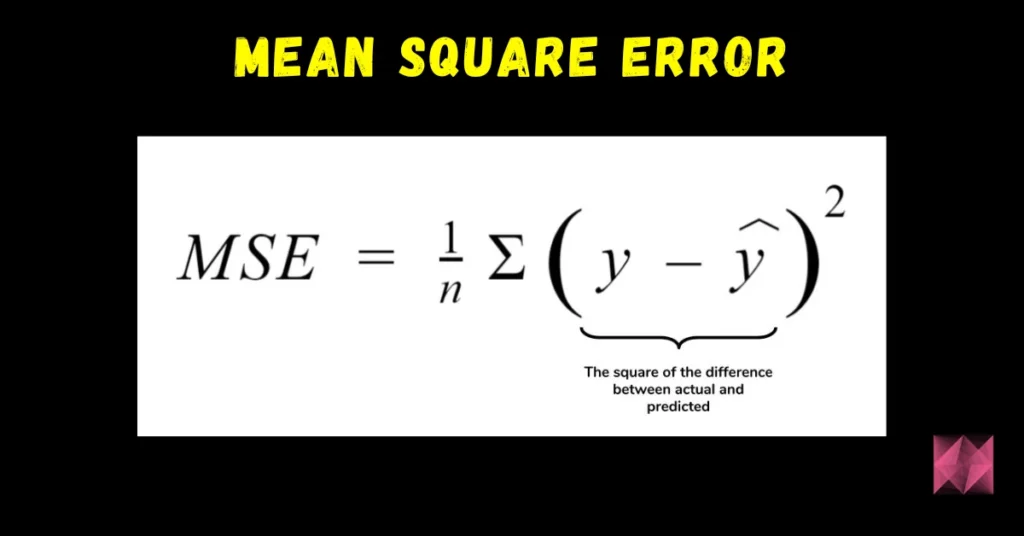
- Yi is the actual value of the output variable (the ith data point)
- Y(cap) is the predicted value and,
- N is the total number of data points.
So, RMSE is the square root of MSE.
25. What are Support Vectors in SVM (Support Vector Machine)?
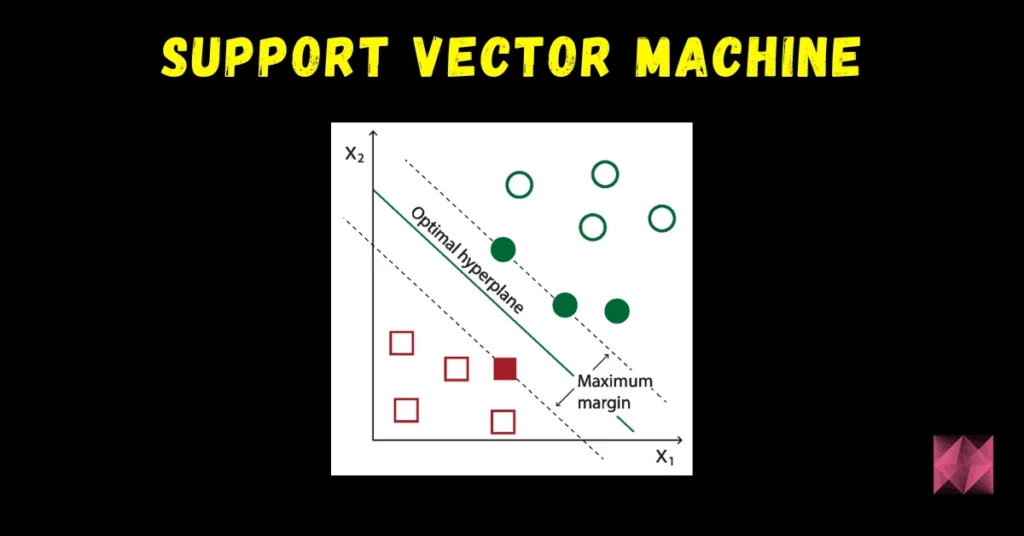
In the above diagram, we can see that the thin lines mark the distance from the classifier to the closest data points (darkened data points). These are called support vectors. So, we can define the support vectors as the data points or vectors that are nearest (closest) to the hyperplane. They affect the position of the hyperplane. Since they support the hyperplane, they are known as support vectors.
26. So, you have done some projects in machine learning and data science and we see you are a bit experienced in the field. Let’s say your laptop’s RAM is only 4GB and you want to train your model on 10GB data set.
What will you do? Have you experienced such an issue before?
In such types of questions, we first need to ask what ML model we have to train. After that, it depends on whether we have to train a model based on Neural Networks or SVM.
The steps for Neural Networks are given below:
- The Numpy array can be used to load the entire data. It will never store the entire data, rather just create a mapping of the data.
- Now, in order to get some desired data, pass the index into the NumPy Array.
- This data can be used to pass as an input to the neural network maintaining a small batch size.
The steps for SVM are given below:
- For SVM, small data sets can be obtained. This can be done by dividing the big data set.
- The subset of the data set can be obtained as an input if using the partial fit function.
- Repeat the step of using the partial fit method for other subsets as well.
Now, you may describe the situation if you have faced such an issue in your projects or working in machine learning/ data science.
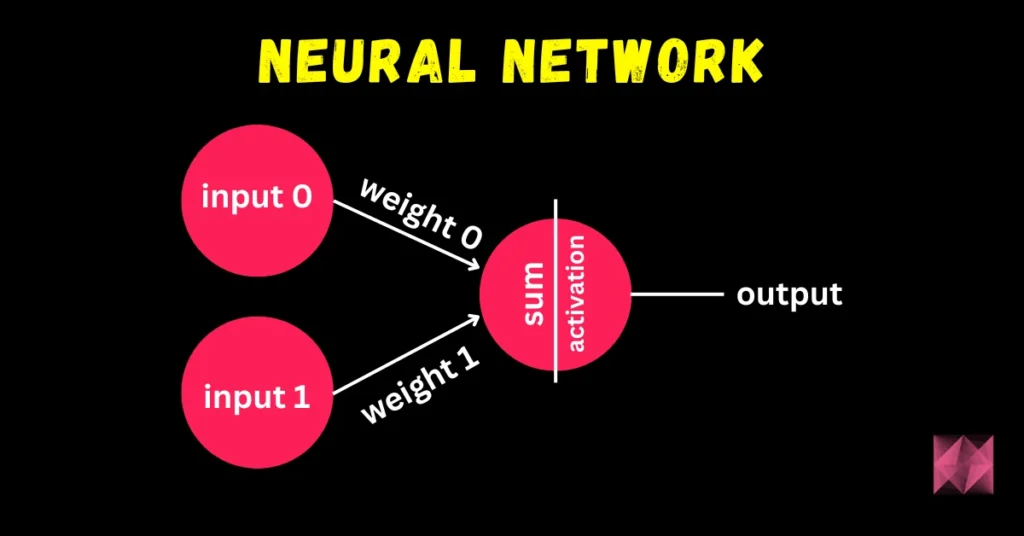
27. Explain Neural Network Fundamentals.
In the human brain, different neurons are present. These neurons combine and perform various tasks. The Neural Network in deep learning tries to imitate human brain neurons. The neural network learns the patterns from the data and uses the knowledge that it gains from various patterns to predict the output for new data, without any human assistance.
A perceptron is the simplest neural network that contains a single neuron that performs 2 functions. The first function is to perform the weighted sum of all the inputs and the second is an activation function.
There are some other neural networks that are more complicated. Such networks consist of the following three layers:
- Input Layer: The neural network has the input layer to receive the input.
- Hidden Layer: There can be multiple hidden layers between the input layer and the output layer. The initially hidden layers are used for detecting the low-level patterns whereas the further layers are responsible for combining output from previous layers to find more patterns.
- Output Layer: This layer outputs the prediction.
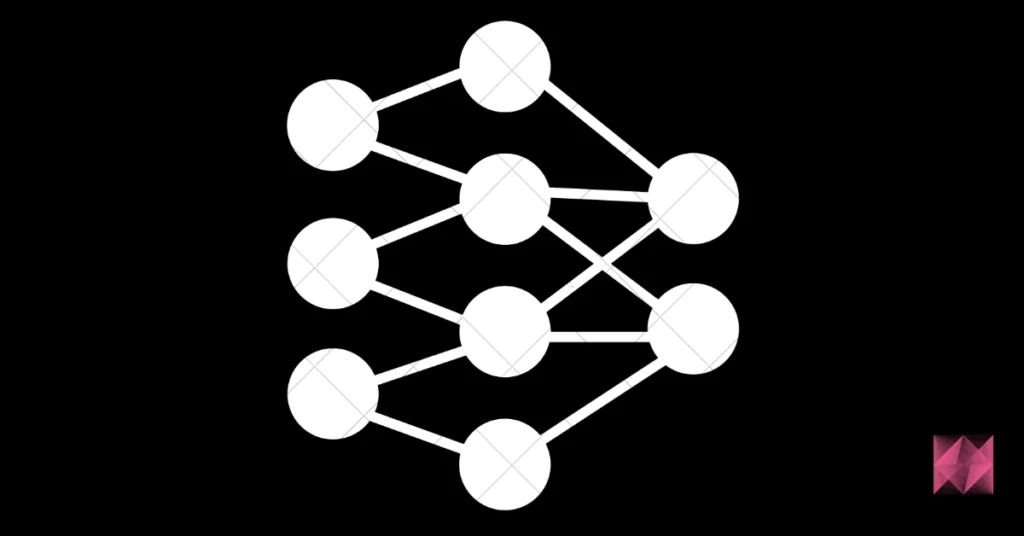
An example neural network image is shown below:
28. What is Generative Adversarial Network?
This approach can be understood with the famous example of the wine seller. Let us say that there is a wine seller who has his own shop. This wine seller purchases wine from the dealers who sell him the wine at a low cost so that he can sell the wine at a high cost to the customers. Now, let us say that the dealers whom he is purchasing the wine from, are selling him fake wine. They do this as the fake wine costs way less than the original wine and the fake and the real wine are indistinguishable to a normal consumer (customer in this case). The shop owner has some friends who are wine experts and he sends his wine to them every time before keeping the stock for sale in his shop. So, his friends, the wine experts, give him feedback that the wine is probably fake. Since the wine seller has been purchasing the wine for a long time from the same dealers, he wants to make sure that their feedback is right before he complains to the dealers about it. Now, let us say that the dealers also have got a tip from somewhere that the wine seller is suspicious of them.
So, in this situation, the dealers will try their best to sell the fake wine whereas the wine seller will try his best to identify the fake wine.
From the image above, it is clear that a noise vector is entering the generator (dealer) and he generates the fake wine and the discriminator has to distinguish between the fake wine and real wine. This is a Generative Adversarial Network (GAN).
In a GAN, there are 2 main components viz. Generator and Discrminator. So, the generator is a CNN that keeps producing images and the discriminator tries to identify the real images from the fake ones.
29. What is a computational graph?
A computational graph is also known as a “Dataflow Graph”. Everything in the famous deep learning library TensorFlow is based on the computational graph. The computational graph in Tensorflow has a network of nodes where each node operates. The nodes of this graph represent operations and the edges represent tensors.
30. What are auto-encoders?
Auto-encoders are learning networks. They transform inputs into outputs with minimum possible errors. So, basically, this means that the output that we want should be almost equal to or as close to the input as follows.
Multiple layers are added between the input and the output layer and the layers that are in between the input and the output layer are smaller than the input layer. It received unlabelled input. This input is encoded to reconstruct the input later.
31. What are Exploding Gradients and Vanishing Gradients?
- Exploding Gradients: Let us say that you are training an RNN. Say, you saw exponentially growing error gradients that accumulate, and as a result of this, very large updates are made to the neural network model weights. These exponentially growing error gradients that update the neural network weights to a great extent are called Exploding Gradients.
- Vanishing Gradients: Let us say again, that you are training an RNN. Say, the slope became too small. This problem of the slope becoming too small is called Vanishing Gradient. It causes a major increase in the training time and causes poor performance and extremely low accuracy.
32. What is the p-value and what does it indicate in the Null Hypothesis?
P-value is a number that ranges from 0 to 1. In a hypothesis test in statistics, the p-value helps in telling us how strong the results are. The claim that is kept for experiment or trial is called Null Hypothesis.
- A low p-value i.e. p-value less than or equal to 0.05 indicates the strength of the results against the Null Hypothesis which in turn means that the Null Hypothesis can be rejected.
- A high p-value i.e. p-value greater than 0.05 indicates the strength of the results in favour of the Null Hypothesis i.e. for the Null Hypothesis which in turn means that the Null Hypothesis can be accepted.
33. Since you have experience in the deep learning field, can you tell us why TensorFlow is the most preferred library in deep learning?
TensorFlow is a very famous library in deep learning. The reason is pretty simple actually. It provides C++ as well as Python APIs which makes it very easier to work on. Also, TensorFlow has a fast compilation speed as compared to Keras and Torch (other famous deep learning libraries). Apart from that, TensorFlow supports both GPU and CPU computing devices. Hence, it is a major success and a very popular library for deep learning.
34. Suppose there is a dataset having variables with missing values of more than 30%, how will you deal with such a dataset?
Depending on the size of the dataset, we follow the below ways:
- In case the datasets are small, the missing values are substituted with the mean or average of the remaining data. In pandas, this can be done by using
mean = df.mean()where df represents the pandas dataframe representing the dataset and mean() calculates the mean of the data. To substitute the missing values with the calculated mean, we can usedf.fillna(mean). - For larger datasets, the rows with missing values can be removed and the remaining data can be used for data prediction.
35. What is Cross-Validation?
Cross-Validation is a Statistical technique used for improving a model’s performance. Here, the model will be trained and tested with rotation using different samples of the training dataset to ensure that the model performs well for unknown data. The training data will be split into various groups and the model is run and validated against these groups in rotation.
The most commonly used techniques are:
- K- Fold method
- Leave p-out method
- Leave-one-out method
- Holdout method
36. What are the differences between correlation and covariance?
Although these two terms are used for establishing a relationship and dependency between any two random variables, the following are the differences between them:
- Correlation: This technique is used to measure and estimate the quantitative relationship between two variables and is measured in terms of how strong are the variables related.
- Covariance: It represents the extent to which the variables change together in a cycle. This explains the systematic relationship between pair of variables where changes in one affect changes in another variable.
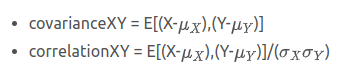
correlation(X,Y) = covariance(X,Y)/(covariance(X) covariance(Y))
Based on the above formula, we can deduce that the correlation is dimensionless whereas covariance is represented in units that are obtained from the multiplication of units of two variables.
37. How do you approach solving any data analytics based project?
Generally, we follow the below steps:
- The first step is to thoroughly understand the business requirement/problem
- Next, explore the given data and analyze it carefully. If you find any data missing, get the requirements clarified by the business.
- Data cleanup and preparation step is to be performed next which is then used for modelling. Here, the missing values are found and the variables are transformed.
- Run your model against the data, build meaningful visualization and analyze the results to get meaningful insights.
- Release the model implementation, and track the results and performance over a specified period to analyze the usefulness.
- Perform cross-validation of the model.
38. How regularly must we update an algorithm in the field of machine learning?
We do not want to update and make changes to an algorithm on a regular basis as an algorithm is a well-defined step procedure to solve any problem and if the steps keep on updating, it cannot be said well defined anymore. Also, this brings in a lot of problems to the systems already implementing the algorithm as it becomes difficult to bring in continuous and regular changes. So, we should update an algorithm only in any of the following cases:
- If you want the model to evolve as data streams through infrastructure, it is fair to make changes to an algorithm and update it accordingly.
- If the underlying data source is changing, it almost becomes necessary to update the algorithm accordingly.
- If there is a case of non-stationarity, we may update the algorithm.
- One of the most important reasons for updating any algorithm is its underperformance and lack of efficiency. So, if an algorithm lacks efficiency or underperforms it should be either replaced by some better algorithm or it must be updated.
39. Why do we need selection bias?
Selection Bias happens in cases where there is no randomization specifically achieved while picking a part of the dataset for analysis. This bias tells that the sample analyzed does not represent the whole population meant to be analyzed.
40. Why is data cleaning crucial? How do you clean the data?
While running an algorithm on any data, to gather proper insights, it is very much necessary to have correct and clean data that contains only relevant information. Dirty data most often results in poor or incorrect insights and predictions which can have damaging effects.
For example, while launching any big campaign to market a product, if our data analysis tells us to target a product that in reality has no demand and if the campaign is launched, it is bound to fail. This results in a loss of the company’s revenue. This is where the importance of having proper and clean data comes into the picture.
- Data Cleaning of the data coming from different sources helps in data transformation and results in data that the data scientists can work on.
- Properly cleaned data increases the accuracy of the model and provides very good predictions.
- If the dataset is very large, then it becomes cumbersome to run data on it. The data cleanup step takes a lot of time (around 80% of the time) if the data is huge. It cannot be incorporated into running the model. Hence, cleaning data before running the model, results in increased speed and efficiency of the model.
- Data cleaning helps to identify and fix any structural issues in the data. It also helps in removing any duplicates and helps to maintain the consistency of the data.
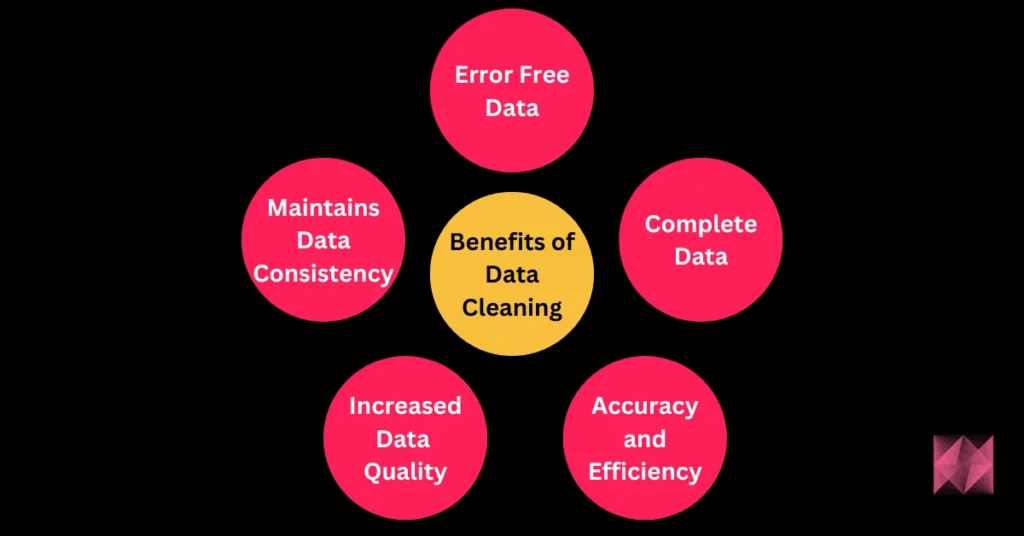
The following diagram represents the advantages of data cleaning:
41. What are the available feature selection methods for selecting the right variables for building efficient predictive models?
While using a dataset in data science or machine learning algorithms, it so happens that not all the variables are necessary and useful to build a model. Smarter feature selection methods are required to avoid redundant models to increase the efficiency of our model. The following are the three main methods in feature selection:
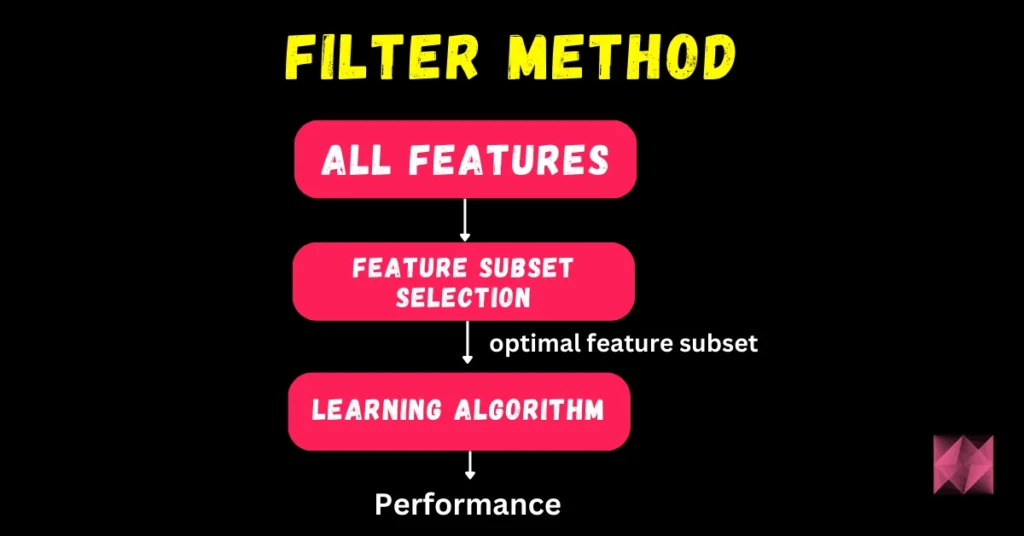
- Filter Methods:
- These methods pick up only the intrinsic properties of features that are measured via univariate statistics and not cross-validated performance. They are straightforward and are generally faster and require less computational resources when compared to wrapper methods.
- There are various filter methods such as the Chi-Square test, Fisher’s Score method, Correlation Coefficient, Variance Threshold, Mean Absolute Difference (MAD) method, Dispersion Ratios, etc.
- Wrapper Methods:
- These methods need some sort of method to search greedily on all possible feature subsets, access their quality by learning and evaluating a classifier with the feature.
- The selection technique is built upon the machine learning algorithm on which the given dataset needs to fit.
- There are three types of wrapper methods, they are:
- Forward Selection: Here, one feature is tested at a time and new features are added until a good fit is obtained.
- Backward Selection: Here, all the features are tested and the non-fitting ones are eliminated one by one to see while checking which works better.
- Recursive Feature Elimination: The features are recursively checked and evaluated how well they perform.
- These methods are generally computationally intensive and require high-end resources for analysis. But these methods usually lead to better predictive models having higher accuracy than filter methods.
- Embedded Methods:
- Embedded methods constitute the advantages of both filter and wrapper methods by including feature interactions while maintaining reasonable computational costs.
- These methods are iterative as they take each model iteration and carefully extract features contributing to most of the training in that iteration.
- Examples of embedded methods: LASSO Regularization (L1), Random Forest Importance.
42. During analysis, how do you treat the missing values?
To identify the extent of missing values, we first have to identify the variables with the missing values. Let us say a pattern is identified. The analyst should now concentrate on them as it could lead to interesting and meaningful insights. However, if there are no patterns identified, we can substitute the missing values with the median or mean values or we can simply ignore the missing values.
If the variable is categorical, the default value to the mean, minimum, and maximum is assigned. The missing value is assigned to the default value. If we have a distribution of data coming, for normal distribution, we give the mean value.
If 80% of the values are missing for a particular variable, then we would drop the variable instead of treating the missing values.
43. Will treating categorical variables as continuous variables result in a better predictive model?
Yes! A categorical variable is a variable that can be assigned to two or more categories with no definite category ordering. Ordinal variables are similar to categorical variables with proper and clear ordering defines. So, if the variable is ordinal, then treating the categorical value as a continuous variable will result in better predictive models.
44. How will you treat missing values during data analysis?
The impact of missing values can be known after identifying what kind of variables have missing values.
- If the data analyst finds any pattern in these missing values, then there are chances of finding meaningful insights.
- In case of patterns are not found, then these missing values can either be ignored or can be replaced with default values such as mean, minimum, maximum, or median values.
- If the missing values belong to categorical variables, then they are assigned default values. If the data has a normal distribution, then mean values are assigned to missing values.
- If 80% of values are missing, then it depends on the analyst to either replace them with default values or drop the variables.
45. What does the ROC Curve represent and how to create it?
ROC (Receiver Operating Characteristic) curve is a graphical representation of the contrast between false-positive rates and true-positive rates at different thresholds. The curve is used as a proxy for a trade-off between sensitivity and specificity.
The ROC curve is created by plotting values of true positive rates (TPR or sensitivity) against false-positive rates (FPR or (1-specificity)) TPR represents the proportion of observations correctly predicted as positive out of overall positive observations. The FPR represents the proportion of observations incorrectly predicted out of overall negative observations. Consider the example of medical testing, the TPR represents the rate at which people are correctly tested positive for a particular disease.
46. What are the differences between univariate, bivariate, and multivariate analysis?
Statistical analyses are classified based on the number of variables processed at a given time.
| Univariate analysis | Bivariate analysis | Multivariate analysis |
|---|---|---|
| This analysis deals with solving only one variable at a time. | This analysis deals with the statistical study of two variables at a given time. | This analysis deals with statistical analysis of more than two variables and studies the responses. |
| Example: Sales pie charts based on territory. | Example: Scatterplot of Sales and spend volume analysis study. | Example: Study of the relationship between human’s social media habits and their self-esteem which depends on multiple factors like age, number of hours spent, employment status, relationship status, etc. |
47. What is the difference between the Test set and validation set?
The test set is used to test or evaluate the performance of the trained model. It evaluates the predictive power of the model.
The validation set is part of the training set that is used to select parameters for avoiding model overfitting.
48. What do you understand by a kernel trick?
Kernel functions are generalized dot product functions used for the computing dot product of vectors xx and yy in high dimensional feature space. Kernal trick method is used for solving a non-linear problem by using a linear classifier by transforming linearly inseparable data into separable ones in higher dimensions.
49. Differentiate between box plot and histogram.
Box plots and histograms are both visualizations used for showing data distributions for efficient communication of information.
Histograms are the bar chart representation of information that represents the frequency of numerical variable values that are useful in estimating probability distribution, variations, and outliers.
Boxplots are used for communicating different aspects of data distribution where the shape of the distribution is not seen but still insights can be gathered. These are useful for comparing multiple charts at the same time as they take less space when compared to histograms.
50. How will you balance/correct imbalanced data?
There are different techniques to correct/balance imbalanced data. It can be done by increasing the sample numbers for minority classes. The number of samples can be decreased for those classes with extremely high data points. Following are some approaches followed to balance data:
- Use the right evaluation metrics: In cases of imbalanced data, it is very important to use the right evaluation metrics that provide valuable information.
- Specificity/Precision: Indicates the number of selected instances that are relevant.
- Sensitivity: Indicates the number of relevant instances that are selected.
- F1 score: It represents the harmonic mean of precision and sensitivity.
- MCC (Matthews correlation coefficient): It represents the correlation coefficient between observed and predicted binary classifications.
- AUC (Area Under the Curve): This represents a relation between the true positive rates and false-positive rates.
- Training Set Resampling: It is also possible to balance data by working on getting different datasets and this can be achieved by resampling. There are two approaches followed under-sampling that is used based on the use case and the requirements:
- Under-sampling This balances the data by reducing the size of the abundant class and is used when the data quantity is sufficient. By performing this, a new dataset that is balanced can be retrieved and this can be used for further modeling.
- Over-sampling This is used when data quantity is not sufficient. This method balances the dataset by trying to increase the samples size. Instead of getting rid of extra samples, new samples are generated and introduced by employing the methods of repetition, bootstrapping, etc.
- Perform K-fold cross-validation correctly: Cross-Validation needs to be applied properly while using over-sampling. The cross-validation should be done before over-sampling because if it is done later, then it would be like overfitting the model to get a specific result. To avoid this, resampling of data is done repeatedly with different ratios.
51. What is better – random forest or multiple decision trees?
Random forest is better than multiple decision trees as random forests are much more robust, accurate, and lesser prone to overfitting as it is an ensemble method that ensures multiple weak decision trees learn strongly.
52. Consider a case where you know the probability of finding at least one shooting star in a 15-minute interval is 30%. Evaluate the probability of finding at least one shooting star in a one-hour duration.
We know that,
Probability of finding at least 1 shooting star in 15 min = P(sighting in 15min) = 30% = 0.3
Hence, the Probability of not sighting any
shooting star in 15 min = 1-P(sighting in 15min)
= 1-0.3
= 0.7
Probability of not finding shooting star in 1 hour
= 0.7^4
= 0.1372
Probability of finding atleast 1
shooting star in 1 hour = 1-0.1372
= 0.8628
So the probability is 0.8628 = 86.28%
53. Toss the selected coin 10 times from a jar of 1000 coins. Out of 1000 coins, 999 coins are fair and 1 coin is double-headed, assume that you see 10 heads. Estimate the probability of getting a head in the next coin toss.
We know that there are two types of coins – fair and double-headed. Hence, there are two possible ways of choosing a coin. The first is to choose a fair coin and the second is to choose a coin having 2 heads.
P(selecting fair coin) = 999/1000 = 0.999
P(selecting double-headed coin) = 1/1000 = 0.001
Using Bayes rule,
P(selecting 10 heads in row) = P(selecting fair coin)* Getting 10 heads + P(selecting double headed coin)
P(selecting 10 heads in row) = P(A)+P(B)
P (A) = 0.999 * (1/2)^10
= 0.999 * (1/1024)
= 0.000976
P (B) = 0.001 * 1 = 0.001
P( A / (A + B) ) = 0.000976 / (0.000976 + 0.001) = 0.4939
P( B / (A + B)) = 0.001 / 0.001976
= 0.5061
P(selecting head in next toss) = P(A/A+B) * 0.5 + P(B/A+B) * 1
= 0.4939 * 0.5 + 0.5061
= 0.7531
So, the answer is 0.7531 or 75.3%.
54. What are some examples when false positive has proven important than false negative?
Before citing instances, let us understand what are false positives and false negatives.
- False Positives are those cases that were wrongly identified as an event even if they were not. They are called Type I errors.
- False Negatives are those cases that were wrongly identified as non-events despite being an event. They are called Type II errors.
Some examples where false positives were important than false negatives are:
- In the medical field: Consider that a lab report has predicted cancer to a patient even if he did not have cancer. This is an example of a false positive error. It is dangerous to start chemotherapy for that patient as he doesn’t have cancer as starting chemotherapy would lead to damage of healthy cells and might even actually lead to cancer.
- In the e-commerce field: Suppose a company decides to start a campaign where they give $100 gift vouchers for purchasing $10000 worth of items without any minimum purchase conditions. They assume it would result in at least 20% profit for items sold above $10000. What if the vouchers are given to the customers who haven’t purchased anything but have been mistakenly marked as those who purchased $10000 worth of products? This is the case of a false-positive error.
55. Give one example where both false positives and false negatives are important equally?
In Banking fields: Lending loans are the main source of income for banks. But if the repayment rate isn’t good, then there is a risk of huge losses instead of any profits. So giving out loans to customers is a gamble as banks can’t risk losing good customers but at the same time, they can’t afford to acquire bad customers. This case is a classic example of equal importance in false positive and false negative scenarios.
56. Is it good to do dimensionality reduction before fitting a Support Vector Model?
If the feature number is greater than the observations then doing dimensionality reduction improves the SVM (Support Vector Model).
57. What are various assumptions used in linear regression? What would happen if they are violated?
Linear regression is done under the following assumptions:
- The sample data used for modeling represents the entire population.
- There exists a linear relationship between the X-axis variable and the mean of the Y variable.
- The residual variance is the same for any X values. This is called homoscedasticity
- The observations are independent of one another.
- Y is distributed normally for any value of X.
Extreme violations of the above assumptions lead to redundant results. Smaller violations of these result in greater variance or bias of the estimates.
58. How is feature selection performed using the regularization method?
The method of regularization entails the addition of penalties to different parameters in the machine learning model for reducing the freedom of the model to avoid the issue of overfitting.
There are various regularization methods available such as linear model regularization, Lasso/L1 regularization, etc. The linear model regularization applies a penalty over coefficients that multiplies the predictors. The Lasso/L1 regularization has the feature of shrinking some coefficients to zero, thereby making it eligible to be removed from the model.
59. How do you identify if a coin is biased?
To identify this, we perform a hypothesis test as below:
According to the null hypothesis, the coin is unbiased if the probability of head flipping is 50%. According to the alternative hypothesis, the coin is biased and the probability is not equal to 500. Perform the below steps:
- Flip the coin 500 times
- Calculate p-value.
- Compare the p-value against the alpha -> result of the two-tailed test (0.05/2 = 0.025). The following two cases might occur:
- p-value > alpha: Then the null hypothesis holds good and the coin is unbiased.
- p-value < alpha: Then the null hypothesis is rejected and the coin is biased.
60. What is the importance of dimensionality reduction?
The process of dimensionality reduction constitutes reducing the number of features in a dataset to avoid overfitting and reducing the variance. There are mostly 4 advantages of this process:
- This reduces the storage space and time for model execution.
- Removes the issue of multi-collinearity thereby improving the parameter interpretation of the ML model.
- Makes it easier for visualizing data when the dimensions are reduced.
- Avoids the curse of increased dimensionality.
61. How is the grid search parameter different from the random search tuning strategy?
Tuning strategies are used to find the right set of hyperparameters. Hyperparameters are those properties that are fixed and model-specific before the model is tested or trained on the dataset. Both the grid search and random search tuning strategies are optimization techniques to find efficient hyperparameters.
- Grid Search:
- Here, every combination of a preset list of hyperparameters is tried out and evaluated.
- The search pattern is similar to searching in a grid where the values are in a matrix and a search is performed. Each parameter set is tried out and their accuracy is tracked. after every combination is tried out, the model with the highest accuracy is chosen as the best one.
- The main drawback here is that, if the number of hyperparameters is increased, the technique suffers. The number of evaluations can increase exponentially with each increase in the hyperparameter. This is called the problem of dimensionality in a grid search.
- Random Search:
- In this technique, random combinations of hyperparameter sets are tried and evaluated for finding the best solution. For optimizing the search, the function is tested at random configurations in parameter space.
- In this method, there are increased chances of finding optimal parameters because the pattern followed is random. There are chances that the model is trained on optimized parameters without the need for aliasing.
- This search works best when there is a lower number of dimensions as it takes less time to find the right set.
Frequently Asked Questions
62. How do I prepare for a data science interview?
Some of the preparation tips for data science interviews are as follows:
- Resume Building: Firstly, prepare your resume well. It is preferable if the resume is only a 1-page resume, especially for a fresher. You should give great thought to the format of the resume as it matters a lot. The data science interviews can be based more on the topics like linear and logistic regression, SVM, root cause analysis, random forest, etc. So, prepare well for the data science-specific questions like those discussed in this article, and make sure your resume has a mention of such important topics and that you have a good knowledge of them. Also, please make sure that your resume contains some Data Science-based Projects as well. It is always better to have a group project or internship experience in the field that you are interested to go for. However, personal projects will also have a good impact on the resume. So, your resume should contain at least 2-3 data science-based projects that show your skill and knowledge level in data science. Please do not write any such skill in your resume that you do not possess. If you are just familiar with some technology and have not studied it at an advanced level, you can mention a beginner tag for those skills.
- Prepare Well: Apart from the specific questions on data science, questions on Core subjects like Database Management systems (DBMS), Operating Systems (OS), Computer Networks(CN), and Object-Oriented Programming (OOPS) can be asked from the freshers especially. So, prepare well for that as well.
- Data structures and Algorithms are the basic building blocks of programming. So, you should be well versed in that as well.
- Research the Company: This is the tip that most people miss and it is very important. If you are going for an interview with any company, read about the company before and especially in the case of data science, learn which libraries the company uses, what kind of models are they building, and so on. This gives you an edge over most other people.
63. Are data science interviews hard?
An honest reply will be “YES”. This is because of the fact that this field is newly emerging and will keep on emerging forever. In almost every interview, you have to answer many tough and challenging questions with full confidence and your concepts should be strong to satisfy the interviewer. However, with great practice, anything can be achieved. So, follow the tips discussed above and keep practicing and learning. You will definitely succeed.
64. What are the top 3 technical skills of a data scientist?
The top 3 skills of a data scientist are:
- Mathematics: Data science requires a lot of mathematics and a good data scientist is strong in it. It is not possible to become a good data scientist if you are weak in mathematics.
- Machine Learning and Deep Learning: A data scientist should be very skilled in Artificial Intelligence technologies like deep learning and machine learning. Some good projects and a lot of hands-on practice will help in achieving excellence in that field.
- Programming: This is an obvious yet the most important skill. If a person is good at programming it does mean that he/she can solve complex problems as that is just a problem-solving skill. Programming is the ability to write clean and industry-understandable code. This is the skill that most freshers lack because of the lack of exposure to industry-level code. This also improves with practice and experience.
65. Is data science a good career?
Yes, data science is one of the most futuristic and great career fields. Today and tomorrow or even years later, this field is just going to expand and never end. The reason is simple. Data can be compared to gold today as it is the key to selling everything in the world. Data scientists know how to play with this data to generate some tremendous outputs that are not even imaginable today making it a great career.
66. Are coding questions asked in data science interviews?
Yes, coding questions are asked in data science interviews. One more important thing to note here is that the data scientists are very good problem solvers as they are indulged in a lot of strict mathematics-based activities. Hence, the interviewer expects the data science interview candidates to know data structures and algorithms and at least come up with the solutions to most of the problems.
67. Is Python and SQL enough for data science?
Yes. Python and SQL are sufficient for the data science roles. However, knowing the R programming Language can also have a better impact. If you know these 3 languages, you have got the edge over most of the competitors. However, Python and SQL are enough for data science interviews.
68. What are Data Science tools?
There are various data science tools available in the market nowadays. Various tools can be of great importance. TensorFlow is one of the most famous data science tools. Some of the other famous tools are BigML, SAS (Statistical Analysis System), Knime, Scikit, Pytorch, etc.
Conclusion
Data science interviews can be daunting, but with thorough preparation and a solid understanding of the fundamental concepts, you can greatly enhance your chances of success. The questions presented in this article cover various aspects of data science, including machine learning, data preprocessing, model evaluation, and more.
So this is all for this blog folks. These were some of the best Data Science Interview Questions that you can go through before an interview. Thanks for reading it and I hope you are taking something with you after reading this and till the next time …
Read my last Blog: 100+ Best Python Interview Questions
Check out my other machine learning projects, deep learning projects, computer vision projects, NLP projects, and Flask projects at machinelearningprojects.net.
