In this blog, we will be performing House Tax Prediction using the Random Forest algorithm. We will be using the very famous Boston Housing Data for this problem. So without further due, Let’s do it…
Checkout the video here – https://youtu.be/xNIvhWZzoew
Step 1 – Importing required packages.
import numpy as np
import pandas as pd
import seaborn as sns
import matplotlib.pyplot as plt
from sklearn.model_selection import train_test_split
from sklearn.metrics import r2_score

%matplotlib inline
Step 2 – Reading our data.
data = pd.read_csv('HousingData.csv')
data.head()

Step 3 – Describe our data.
data.describe()

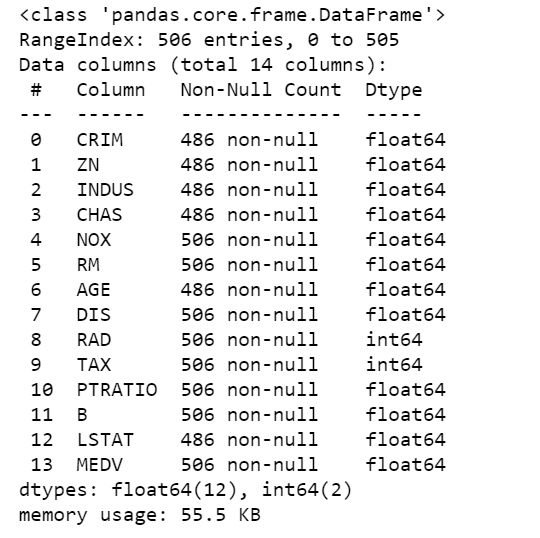
Step 4 – Check the info of our data.
data.info()
- As we can see below that there are 4 5 columns that do not have 506 values, which means they have some null values in them.
- That’s why we need to fill these null values to make every column of equal size.
Step 5 – Filling null values.
col = ['CRIM','ZN','INDUS','CHAS','AGE','LSTAT']
for c in col:
    data[c].fillna(data[c].mean(),inplace=True)
- Here we are simply filling the null fields with the mean of that column.
- We have passed ‘inplace=True’ because we want to make this change in our original dataset.
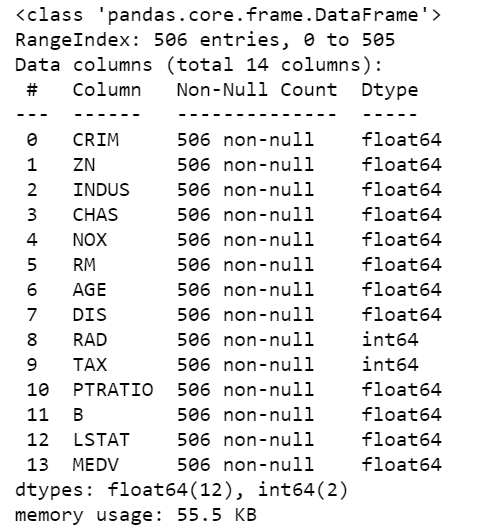
Step 6 – Now again check the info of our data.
data.info()
- We can see below, that now all the columns have 506 non-null values.
- This is a very important step in Data Preprocessing. We must either remove entries with null values or fill them with some default value or we can also fill them by the average value as we did in this case.
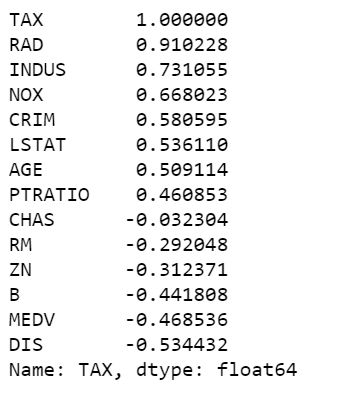
Step 7 – Check the correlation of our target field ‘TAX’ with other features.
data.corr()['TAX'].sort_values(ascending=False)
- Here we are just checking the correlation of our target column that is ‘TAX’ with other columns.
- We can see that it has the highest correlation with the ‘RAD’ column. This means the TAX value is directly proportional to the RAD value.
Step 8 – Preprocessing our data.
from sklearn.preprocessing import StandardScaler

X = data.drop('TAX',axis=1)
y = data['TAX']

scaler = StandardScaler()
X = scaler.fit_transform(X)

X_train, X_test, y_train, y_test = train_test_split(X, y, test_size=0.3, random_state=42)
- We are creating X, which is our features/all columns except labels/TAX column.
- We are creating y which is just the TAX column.
- We are scaling the X data using Standard Scaler to bring everything down to the same scale of [0-1].
- Then we are just simply splitting our data in 70-30 proportions for training and testing data respectively using train-test-split.
Step 9 – Training our House Tax Prediction model.
from sklearn.ensemble import RandomForestRegressor
from sklearn.model_selection import GridSearchCV

rfc = RandomForestRegressor()
params = {'n_estimators':[100,200,300,400,500,600,700,800,900,1000]}

grid_model = GridSearchCV(rfc, params,verbose=2)
grid_model.fit(X_train,y_train)

pred = grid_model.predict(X_test)

print('Random Forest accuracy is --> ',r2_score(y_test,pred)*100)
- We have chosen Random Forest Regressor for this particular problem statement.
- I also tried Linear Regression, Lasso Regression, and Ridge Regression but all of them gave a lesser r2 score than Random Forest.
- Here we are using Grid Search CV to find the best value of the ‘n_estimator’ parameter of Random Forest.

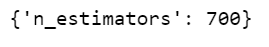
Step 10 -Checking the best parameters for the House Tax Prediction model.
grid_model.best_params_
- Using Grid Search CV, we came to know that the best value for n_estimator would be 700.
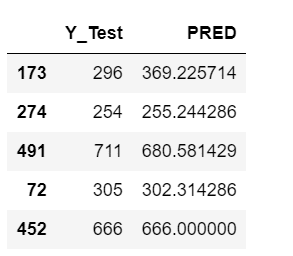
Step 11 – Just watch the results.
res = pd.DataFrame()
res['Y_Test'] = y_test
res['PRED'] = pred
res.head()
- Just a simple step where we see what is our prediction and what it should be.
Step 12 – Plotting out the results of House Tax Prediction.
sns.scatterplot(y_test,pred)
plt.xlabel('real values')
plt.ylabel('predicted values')

Download Source Code for House Tax Prediction…
Do let me know if there’s any query regarding House Tax Prediction by contacting me on email or LinkedIn.
So this is all for this blog folks, thanks for reading it and I hope you are taking something with you after reading this and till the next time ?…
Read my previous post: PEDESTRIAN DETECTION USING HOGS IN PYTHON
Check out my other machine learning projects, deep learning projects, computer vision projects, NLP projects, Flask projects at machinelearningprojects.net.