In today’s blog, we will see how we can build a Wine Quality Prediction model using the Random Forest algorithm. So without any further due, Let’s do it…
Checkout the video here – https://youtu.be/7_IjRrns_uo
Step 1 – Importing libraries required for Wine Quality Prediction.
import numpy as np
import pandas as pd
import seaborn as sns
from sklearn.svm import SVC
import matplotlib.pyplot as plt
from sklearn.linear_model import SGDClassifier
from sklearn.preprocessing import LabelEncoder
from sklearn.model_selection import GridSearchCV
from sklearn.ensemble import RandomForestClassifier
from sklearn.metrics import classification_report,confusion_matrix,accuracy_score

%matplotlib inline
Step 2 – Read input data.
wine = pd.read_csv('winequality-red.csv')
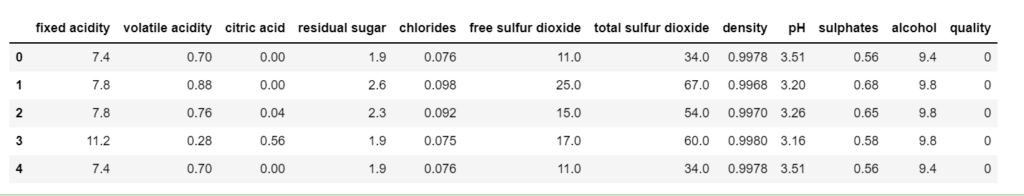
wine.head()
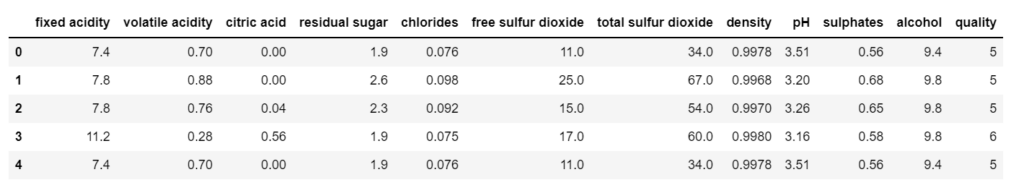
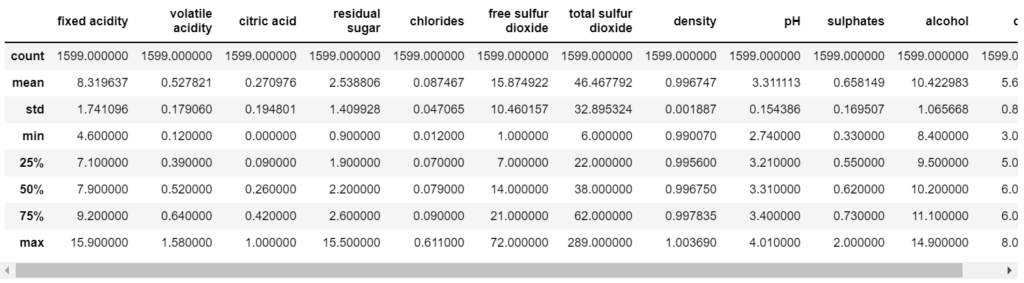
Step 3 – Describe the data.
wine.describe()
Step 4 – Take info from the data.
wine.info()
- From the data below, we can infer that there is no NULL value in our data.

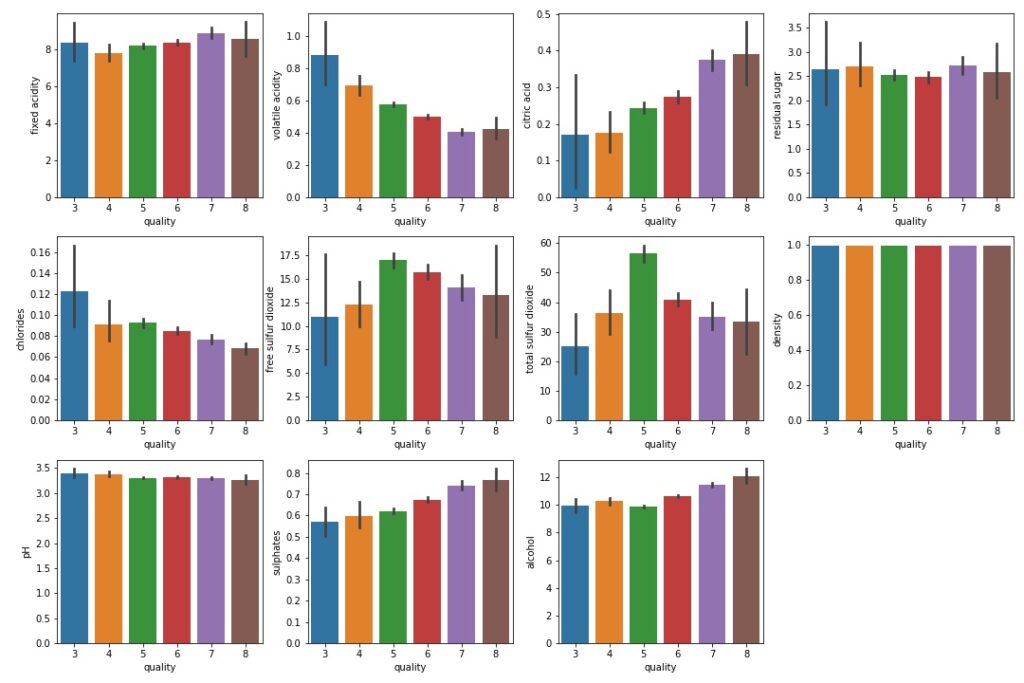
Step 5 – Plot out the data.
fig = plt.figure(figsize=(15,10))

plt.subplot(3,4,1)
sns.barplot(x='quality',y='fixed acidity',data=wine)

plt.subplot(3,4,2)
sns.barplot(x='quality',y='volatile acidity',data=wine)

plt.subplot(3,4,3)
sns.barplot(x='quality',y='citric acid',data=wine)

plt.subplot(3,4,4)
sns.barplot(x='quality',y='residual sugar',data=wine)

plt.subplot(3,4,5)
sns.barplot(x='quality',y='chlorides',data=wine)

plt.subplot(3,4,6)
sns.barplot(x='quality',y='free sulfur dioxide',data=wine)

plt.subplot(3,4,7)
sns.barplot(x='quality',y='total sulfur dioxide',data=wine)

plt.subplot(3,4,8)
sns.barplot(x='quality',y='density',data=wine)

plt.subplot(3,4,9)
sns.barplot(x='quality',y='pH',data=wine)

plt.subplot(3,4,10)
sns.barplot(x='quality',y='sulphates',data=wine)

plt.subplot(3,4,11)
sns.barplot(x='quality',y='alcohol',data=wine)

plt.tight_layout()
- From the plots below we can infer:
- Quality is high when volatile acidity is less.
- Quality is high when citric acid is high.
- Quality is high when chlorides are less.
- Quality is high when sulphates are more.
- Quality is high when alcohol is more.
Step 6 – Count the no. of instances of each class.
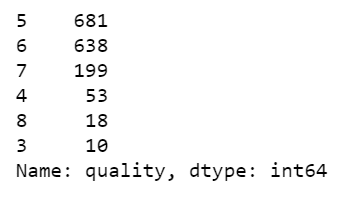
wine['quality'].value_counts()
- We can see that we have 6 classes of quality that are 3,4,5,6,7,8 but we don’t want it like this.
- So what we will do is we will mark every rating from 3 to 6 as BAD and ratings of 7 and 8 as GOOD.
Step 7 – Make just 2 categories good and bad.
ranges = (2,6.5,8)
groups = ['bad','good']
wine['quality'] = pd.cut(wine['quality'],bins=ranges,labels=groups)
- Here we are cutting bins use pd.cut() in 2 categories 2-6.5 as BAD and 6.5-8 as GOOD.
Step 8 – Alloting 0 to bad and 1 to good.
le = LabelEncoder()
wine['quality'] = le.fit_transform(wine['quality'])
wine.head()
- Replace BAD with 0.
- Replace GOOD with 1.
- For reference see the quality column in the image below.
Step 9 – Again check counts.
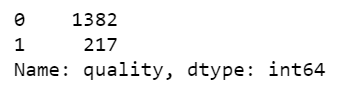
wine['quality'].value_counts()
- Now we have just 2 classes, 0 and 1 or BAD and GOOD.
- But as we can see that the data is highly unbalanced, so we will balance it in the next step.
Step 10 – Balancing the two classes.
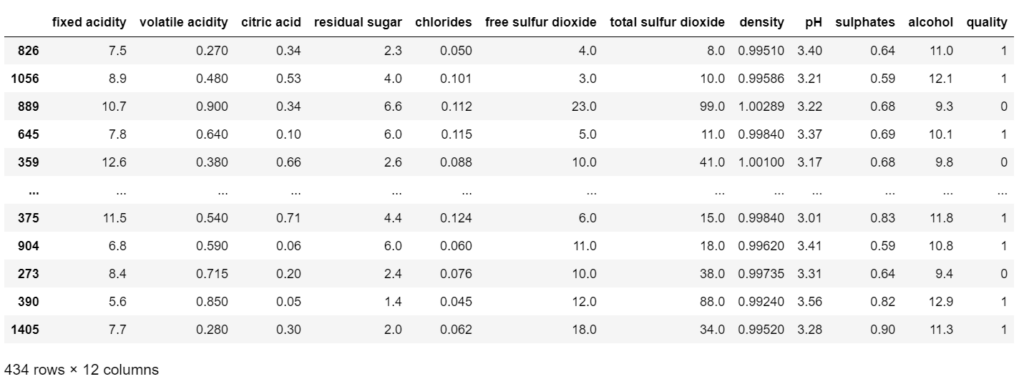
good_quality = wine[wine['quality']==1]
bad_quality = wine[wine['quality']==0]

bad_quality = bad_quality.sample(frac=1)
bad_quality = bad_quality[:217]

new_df = pd.concat([good_quality,bad_quality])
new_df = new_df.sample(frac=1)
new_df
- In this step, we are simply balancing our dataset.
- We are making a new data frame good_quality in which we will have data of just good_quality wine or we can say where the quality is 1.
- Similarly, we are making for bad_quality.
- Then we are simply shuffling bad quality data using df.sample(frac=1). It means shuffle the data and take a 100% fraction of the data.
- Then we are taking out 217 samples of bad_quality because we have just 217 samples of good_quality.
- Then we are joining both 217 samples of each class and our final data frame will have 217*2=434 rows.
- Finally, again shuffling the data.
Step 11 – Again check the counts of classes in the new dataframe.
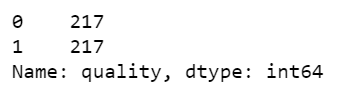
new_df['quality'].value_counts()
- Now we can see that both the classes have 217 instances and hence our data is shuffled.
Step 12 – Checking the correlation between columns.
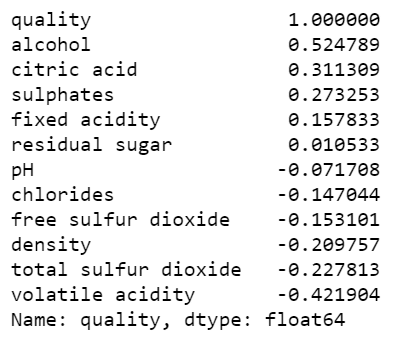
new_df.corr()['quality'].sort_values(ascending=False)
- From the image below we can infer that quality is highly dependent on the alcohol quantity in the wine.
Step 13 – Splitting the data into train and test.
from sklearn.model_selection import train_test_split

X = new_df.drop('quality',axis=1)
y = new_df['quality']

X_train, X_test, y_train, y_test = train_test_split(X, y, test_size=0.3, random_state=101)
Step 14 – Finally training our Wine Quality Prediction model.
param = {'n_estimators':[100,200,300,400,500,600,700,800,900,1000]}
grid_rf = GridSearchCV(RandomForestClassifier(),param,scoring='accuracy',cv=10,)
grid_rf.fit(X_train, y_train)
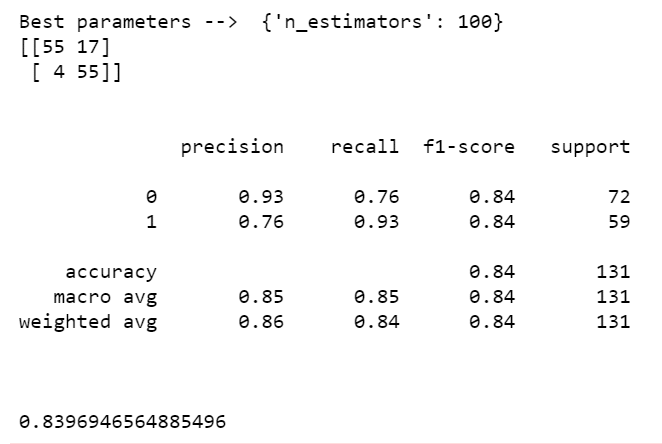
print('Best parameters --> ', grid_rf.best_params_)
# Wine Quality Prediction
pred = grid_rf.predict(X_test)
print(confusion_matrix(y_test,pred))
print('\n')
print(classification_report(y_test,pred))
print('\n')
print(accuracy_score(y_test,pred))
- I also used some other algorithms like SVM and SGD Classifier but Random Forest stood out as always.
- Here I have used GridSearchCV with Random Forest to find the best value of the ‘n_estimators’ parameter.
- Finally, we ended up with an accuracy of 83.9% which is very good for this much small dataset.
Download Source Code for Wine Quality Prediction…
Do let me know if there’s any query regarding Wine Quality Prediction by contacting me on email or LinkedIn. I have tried my best to explain this code
So this is all for this blog folks, thanks for reading it and I hope you are taking something with you after reading this and till the next time…
Read my previous post: FLIPKART REVIEWS EXTRACTION AND SENTIMENT ANALYSIS USING FLASK APP
Check out my other machine learning projects, deep learning projects, computer vision projects, NLP projects, Flask projects at machinelearningprojects.net.
thanks it was great but got stuck in that balancing. can you explain more. it must be always equal?
Hey, if you keep so much difference between the classes, your model will become biased. While training if you give 100 cases of 0 and 2 cases of 1, no matter what instance you give while testing it will always predict 1. That’s why it’s a good practice to balance your classes when the difference is huge.