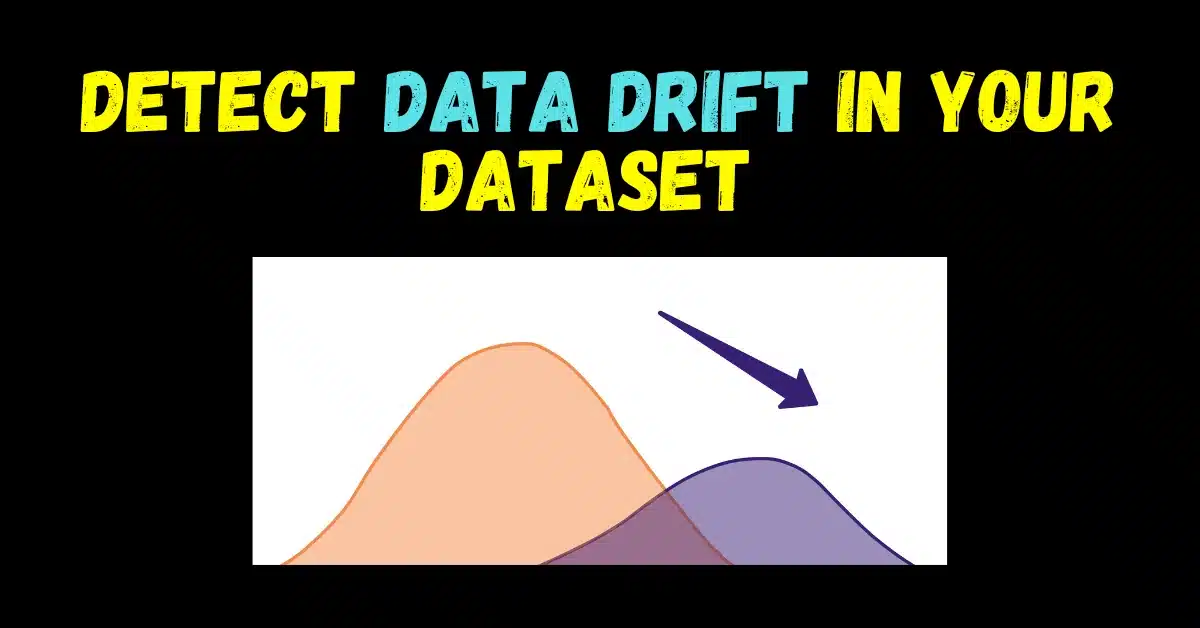
Hey guys, in today’s blog we will see how to Detect Data Drift in your dataset using evidently module in Python. Checking Data Drift is a very important preprocessing step while preparing your data.
This is going to be a very interesting and informative blog, so without any further due, Let’s do it…
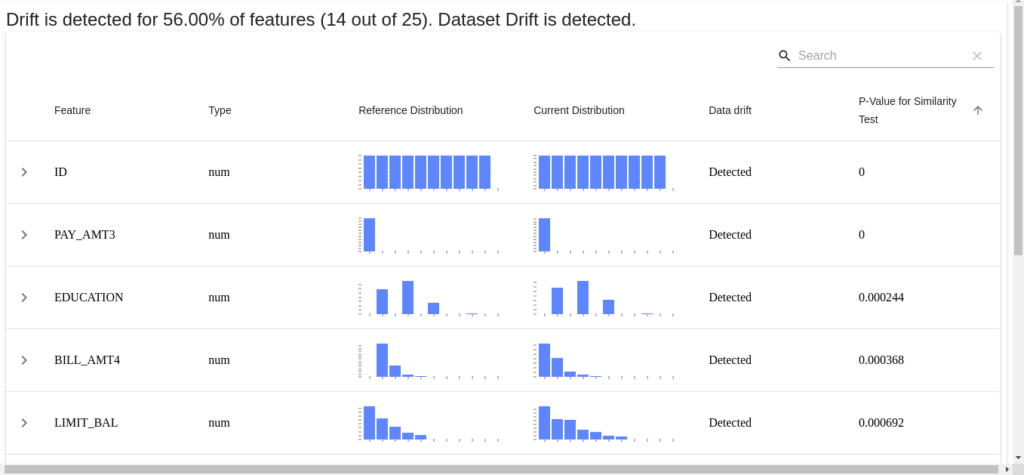
Snapshot of our Final Report…
Step 1 – Importing required Packages
- Importing Pandas to read our CSV dataset.
- Importing Evidently library to create interactive Data Drift Dashboards.
import pandas as pd
from evidently.dashboard import Dashboard
from evidently.dashboard.tabs import DataDriftTab
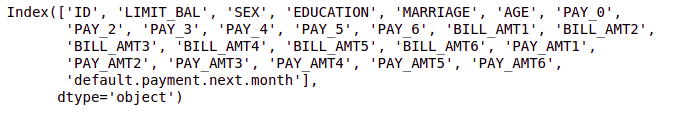
Step 2 – Reading the Data
- Reading our UCI_Credit_Card dataset.
- Printing its columns.
df = pd.read_csv('UCI_Credit_Card.csv')
print(df.columns)
Step 3 – Creating a Data Drift report
- Create a Dashboard object and pass DataDriftTab as the parameter.
- Then calculate the Data Drift using the calculate method which takes two data frames to compare data distributions.
- Then we are simply just saving the Dashboard in the HTML format.
credit_data_drift_dashboard = Dashboard(tabs=[DataDriftTab(verbose_level=1)])
credit_data_drift_dashboard.calculate(df[:25000], df[25000:], column_mapping=None)
credit_data_drift_dashboard.save('DataDrift.html')
print('Data Drift saved')
Our Final Report
- The image below shows the final view of our Dashboard.
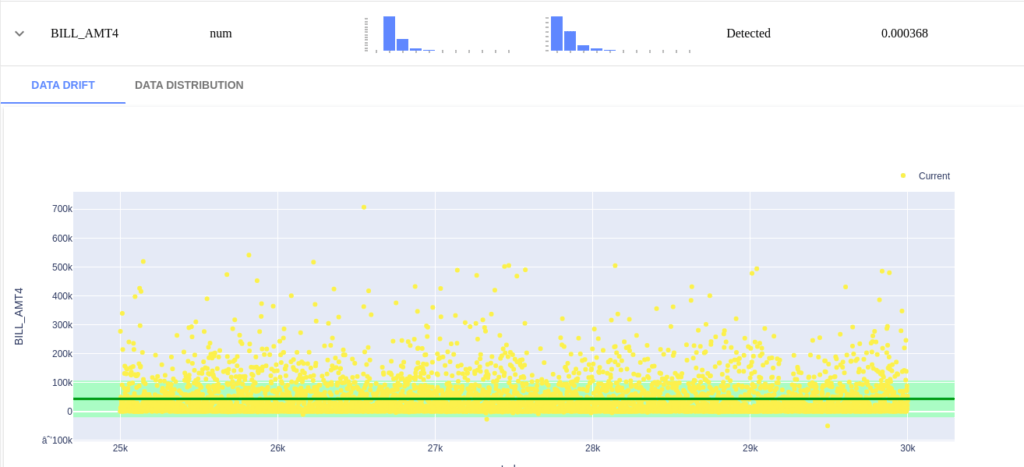
- Let’s observe the BILL_AMT_4 column.
- The first column says that our BILL_AMT_4 is of numeric type.
- Then the next two columns display both, the reference distribution and the current distribution. We can observe the difference between the two.
- Then in the last column, we can see the p-value for the similarity test. You can set your own p-value threshold in the code above.
Let’s open the BILL_AMT_4 field
Let’s see the full code…
import pandas as pd
from evidently.dashboard.tabs import DataDriftTab
from evidently.dashboard import Dashboard


df = pd.read_csv('UCI_Credit_Card.csv')
print(df.columns)


credit_data_drift_dashboard = Dashboard(tabs=[DataDriftTab(verbose_level=1)])
credit_data_drift_dashboard.calculate(df[:25000], df[25000:], column_mapping=None)
credit_data_drift_dashboard.save('DataDrift.html')
print('Data Drift saved')
Do let me know if there’s any query when you Detect Data Drift in your dataset.
So this is all for this blog folks. Thanks for reading it and I hope you are taking something with you after reading this and till the next time …
Read my previous post: How to Deploy a Flask app online using Pythonanywhere
Check out my other machine learning projects, deep learning projects, computer vision projects, NLP projects, and Flask projects at machinelearningprojects.net.


![[Latest] 15+ Best Python Mini Projects – 2026](https://machinelearningprojects.net/wp-content/uploads/2023/05/best-python-mini-projects-1024x536.webp)