
So in today’s blog, we are going to see the magic of edge detection using Sobel X and Sobel Y in cv2. Sobel X and Sobel Y are first-order derivatives. I can assure you that, you will be amazed after watching the results. So without any further due, let’s do it…
Step 1 – Let’s import the required packages.
import cv2
import matplotlib.pyplot as plt
Step 2 – Let’s read the image.
imgpath = "test.tiff"
img = cv2.imread(imgpath, 1)
img = cv2.cvtColor(img, cv2.COLOR_BGR2RGB)
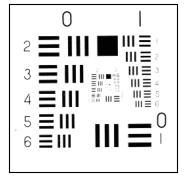
- Here we are reading our image and as always converting it back to the RGB format because we know that cv2 reads the image in BGR format by default.
Step 3 – Let’s find the edges using Sobel X and Sobel Y in cv2.
Syntax – cv2.Sobel(src, ddepth, dx, dy[, ksize[, scale[, delta[, borderType]]]]])
| src | input image |
| ddepth | depth of the output image |
| dx and dy | dx and dy specify whether Sobel-x or Sobel-y is to be used |
| ksize | kernel size |
edgesx = cv2.Sobel(img, -1, dx=1, dy=0, ksize=1)
edgesy = cv2.Sobel(img, -1, dx=0, dy=1, ksize=1)
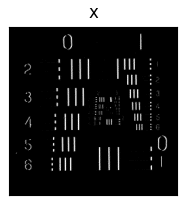
- Sobel X simply finds the first-order derivative in the X-direction. It means that it will detect only those edges which are changing in the X direction (see 1st image).
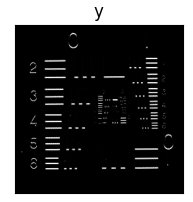
- Similarly, Sobel Y finds the first-order derivative in the Y direction. It means that it will detect only those edges which are changing in the Y direction (see 2nd image).
Read my blog on second-order derivative: HOW TO DETECT EDGES USING LAPLACIAN 2ND ORDER DERIVATIVE IN PYTHON USING OPENCV
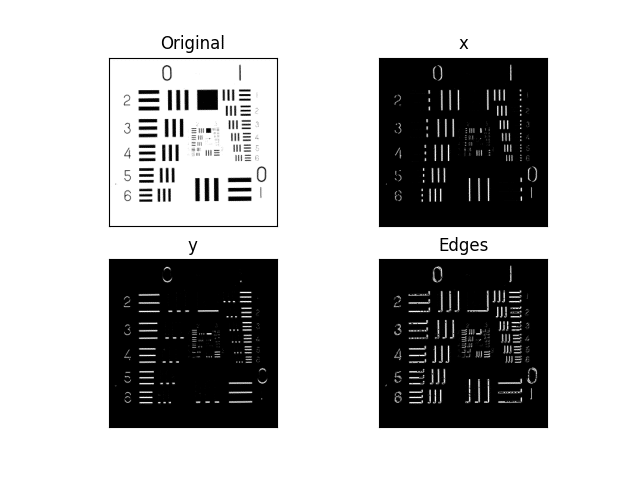
Step 4 – Let’s merge these results of Sobel X and Sobel Y in cv2.
edges = edgesx + edgesy
- We can simply add edges in the X direction and edges in the Y direction to get the overall edges in our image (see final image).
Step 5 – Plot the results.
output = [img, edgesx, edgesy, edges]
titles = ['Original', 'x', 'y', 'Edges']

for i in range(4):
    plt.subplot(2, 2, i + 1)
    plt.imshow(output[i], cmap='gray')
    plt.title(titles[i])
    plt.xticks([])
    plt.yticks([])
plt.show()
Let’s see the whole code…
import cv2
import matplotlib.pyplot as plt

imgpath = "test.tiff"
img = cv2.imread(imgpath, 1)
img = cv2.cvtColor(img, cv2.COLOR_BGR2RGB)

edgesx = cv2.Sobel(img, -1, dx=1, dy=0, ksize=1)
edgesy = cv2.Sobel(img, -1, dx=0, dy=1, ksize=1)

edges = edgesx + edgesy

output = [img, edgesx, edgesy, edges]
titles = ['Original', 'x', 'y', 'Edges']

for i in range(4):
    plt.subplot(2, 2, i + 1)
    plt.imshow(output[i], cmap='gray')
    plt.title(titles[i])
    plt.xticks([])
    plt.yticks([])
plt.show()
NOTE – Read more about Sobel on OpenCV’s documentation page.
Do let me know if there’s any query regarding Sobel X and Sobel Y in cv2 by contacting me on email or LinkedIn.
So this is all for this blog folks, thanks for reading it and I hope you are taking something with you after reading this and till the next time …
Read my previous post: ROTATING AND SCALING IMAGES – A FUN APPLICATION IN PYTHON USING OPENCV
Check out my other machine learning projects, deep learning projects, computer vision projects, NLP projects, Flask projects at machinelearningprojects.net.