
So guys here is yet another one of the most favorite projects of mine. In this blog, we will be implementing a Flight Price Prediction model using different techniques and also we will be performing some data visualizations to better understand our data.
Checkout the video demonstration here – https://youtu.be/LFQ2JwEVf6M
So without any further due, Let’s do it…
Create a conda environment and install the required libraries
conda create -n fpp python=3.9
conda activate fpp
pip install flask flask_cors pandas seaborn sklearn openpyxl
flask run
Step 1 – Importing libraries required for Flight Price Prediction.
import pandas as pd
import seaborn as sns
import numpy as np
import matplotlib.pyplot as plt
import datetime as dt
from sklearn.model_selection import train_test_split, RandomizedSearchCV
from sklearn.ensemble import RandomForestRegressor, ExtraTreesRegressor
import pickle
Step 2 – Reading training data.
train_data = pd.read_excel('Flight Dataset/Data_Train.xlsx')
train_data.head()

Step 3 – Checking values in the Destination column.
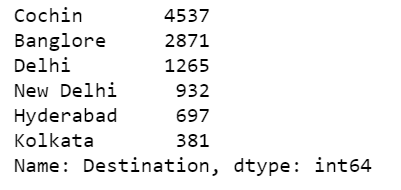
train_data['Destination'].value_counts()
- Maximum people are going to Cochin followed by Bangalore and then Delhi in our dataset.
Step 3.5 – Merging Delhi and New Delhi.
def newd(x):
    if x=='New Delhi':
        return 'Delhi'
    else:
        return x

train_data['Destination'] = train_data['Destination'].apply(newd)
- As we saw above our Destination had Delhi and New Delhi so we merged both of them.
Step 4 – Checking info of our train data.
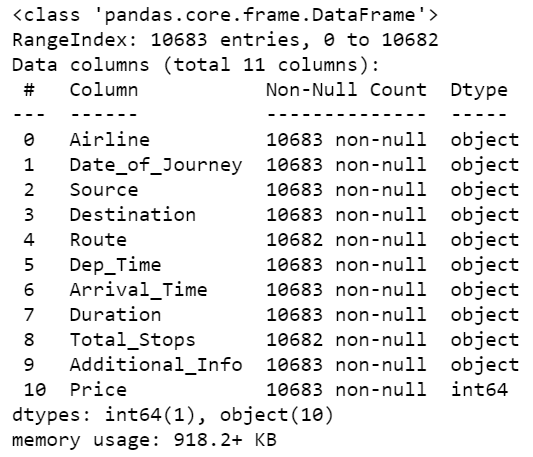
train_data.info()
- We can see that Route and Total stops are having 1 1 NULL values each.
- So we will drop NULL values further.
Step 5 – Make day and month columns as Datetime columns.
train_data['Journey_day'] = pd.to_datetime(train_data['Date_of_Journey'],format='%d/%m/%Y').dt.day
train_data['Journey_month'] = pd.to_datetime(train_data['Date_of_Journey'],format='%d/%m/%Y').dt.month

train_data.drop('Date_of_Journey',inplace=True,axis=1)

train_data.head()
- We will extract the journey day and journey month from the Date of the journey and make 2 columns for them as shown below.
- And then we will drop the Date of the journey column.

Step 6 – Extracting hours and minutes from time.
train_data['Dep_hour'] = pd.to_datetime(train_data['Dep_Time']).dt.hour
train_data['Dep_min'] = pd.to_datetime(train_data['Dep_Time']).dt.minute
train_data.drop('Dep_Time',axis=1,inplace=True)

train_data['Arrival_hour'] = pd.to_datetime(train_data['Arrival_Time']).dt.hour
train_data['Arrival_min'] = pd.to_datetime(train_data['Arrival_Time']).dt.minute
train_data.drop('Arrival_Time',axis=1,inplace=True)

train_data.head()
- As done above we will extract departure hour and departure minutes from departure time.
- And same will be done for arrival time.
- And after that, we will drop both columns.

Step 7 – Checking values in the Duration column.
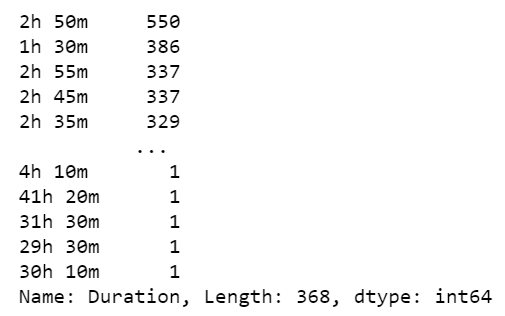
train_data['Duration'].value_counts()
- These are the durations of the flights.
- 550 flights are of 2h 50m duration and so on.
Step 8 – Dropping the Duration column and extracting important info from it.
duration = list(train_data['Duration'])

for i in range(len(duration)):
    if len(duration[i].split()) != 2:
        if 'h' in duration[i]:
            duration[i] = duration[i] + ' 0m'
        else:
            duration[i] = '0h ' + duration[i]

duration_hour = []
duration_min = []

for i in duration:
    h,m = i.split()
    duration_hour.append(int(h[:-1]))
    duration_min.append(int(m[:-1]))

train_data['Duration_hours'] = duration_hour
train_data['Duration_mins'] = duration_min

train_data.drop('Duration',axis=1,inplace=True)
train_data.head()
- Line 1 – Creating a list of all the durations present in the data.
- Line 3-8 – We are just bringing every duration to the same format. There might be a case when some flight duration will be just 30m so we will write it as ‘0h 30m’ and there may also be cases like 2h so we will write it as ‘2h 0m’.
- Line 13-16 – Simply split it into 2 components, hour and minute.
- Line 18-19 – Add two columns ‘Duration_hours’ and ‘Duration_mins’.
- Line 21 – Drop the original Duration column.

Step 9 – Plotting Airline vs Price.
sns.catplot(x='Airline',y='Price',data=train_data.sort_values('Price',ascending=False),kind='boxen',aspect=3,height=6)
- From the plot below we can infer that Jet Airways business is the costliest airways.

Step 10 – Create dummy columns out of the Airline column.
airline = train_data[['Airline']]
airline = pd.get_dummies(airline,drop_first=True)
- As Airline is a categorical column, so we will make dummy columns out of it.
Step 11 – Plotting Source vs Price.
# If we are going from Banglore the prices are slightly higher as compared to other cities
sns.catplot(x='Source',y='Price',data=train_data.sort_values('Price',ascending=False),kind='boxen',aspect=3,height=4)
- The plot below says that if you are going from Bangalore, no matter where you have to pay the highest amount of money.

Step 12 – Create dummy columns out of the Source column.
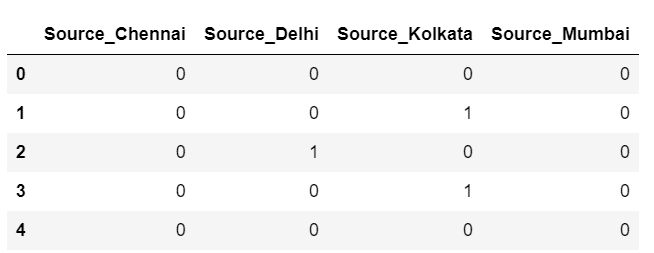
source = train_data[['Source']]
source = pd.get_dummies(source,drop_first=True)
source.head()
- As Source is a categorical column, so we will make dummy columns out of it.
Step 13 – Plotting Destination vs Price.
# If we are going to New Delhi the prices are slightly higher as compared to other cities
sns.catplot(x='Destination',y='Price',data=train_data.sort_values('Price',ascending=False),kind='boxen',aspect=3,height=4)
- The plot below says that if you are going to New Delhi, no matter from where, you have to pay the highest amount of money.

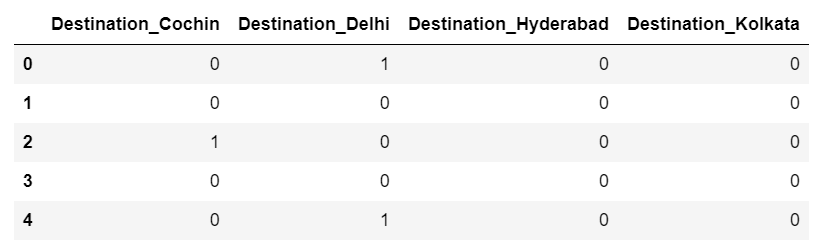
Step 14 – Create dummy columns out of the Destination column.
destination = train_data[['Destination']]
destination = pd.get_dummies(destination,drop_first=True)
destination.head()
- As Destination is also a categorical column, so we will make dummy columns out of it.
Step 15 – Dropping crap columns.
train_data.drop(['Route','Additional_Info'],inplace=True,axis=1)
Step 16 – Checking values in the Total stops column.
train_data['Total_Stops'].value_counts()
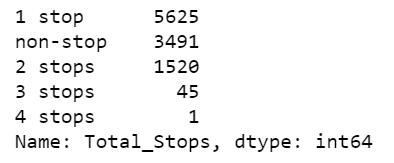
Step 17 – Converting labels into numbers in the Total_stops column.
# acc to the data, price is directly prop to the no. of stops
train_data['Total_Stops'].replace({'non-stop':0,'1 stop':1,'2 stops':2,'3 stops':3,'4 stops':4},inplace=True)
train_data.head()

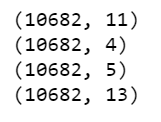
Step 18 – Checking the shapes of our 4 data frames.
print(airline.shape)
print(source.shape)
print(destination.shape)
print(train_data.shape)
- All these 4 data frames have the same number of rows, which means we did everything correctly.
- And now we can join them.
Step 19 – Combine all 4 data frames.
data_train = pd.concat([train_data,airline,source,destination],axis=1)
data_train.drop(['Airline','Source','Destination'],axis=1,inplace=True)
data_train.head()
- Join all 4 data frames.
- Drop the Airline, Source, and, Destination columns.

Step 20 – Taking out train data.
X = data_train.drop('Price',axis=1)
X.head()
- Here we are taking our training data.
- We have taken all the columns except the Price column, which is our target column.

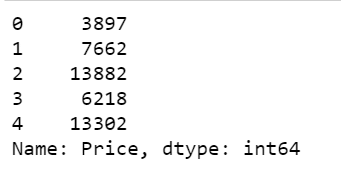
Step 21 – Take out train data labels.
y = data_train['Price']
y.head()
Step 22 – Checking correlations between columns.
plt.figure(figsize=(10,10))
sns.heatmap(train_data.corr(),cmap='viridis',annot=True)
- Just checking the correlation between different features of training data.
- We can see that Total_stops is highly correlated with Duration_hours which is very obvious. If the no. of stops would increase, the duration hours of the flight will also increase.
- Also, price is highly correlated with total stops because if stops would increase that would also require a high quantity of fuel, and that would increase the price.

Step 23 – First try out the ExtraTreesRegressor model for Flight Price Prediction.
reg = ExtraTreesRegressor()
reg.fit(X,y)

print(reg.feature_importances_)
- Let’s fit our data into ExtraTreeRegressor and analyze the feature importances.
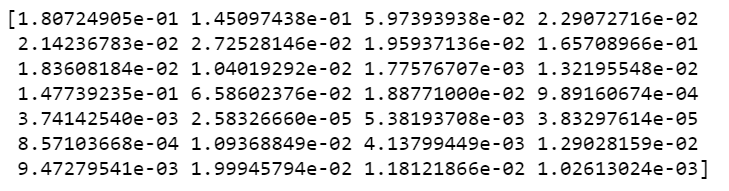
Step 24 – Checking feature importance given by ExtraTreeRegressor.
plt.figure(figsize = (12,8))
feat_importances = pd.Series(reg.feature_importances_, index=X.columns)
feat_importances.nlargest(20).plot(kind='barh')
plt.show()
- Total_stops is the feature with the highest feature importance in deciding the Price as we have also seen above.
- After that Journey Day also plays a big role in deciding the Price. Prices are generally higher on weekends.

Step 25 – Splitting our data into Training and Testing data.
X_train, X_test, y_train, y_test = train_test_split(X, y, test_size = 0.2, random_state = 42)
Step 26 – Training Random Forest Regressor model for Flight Price Prediction.
# Number of trees in random forest
n_estimators = [int(x) for x in np.linspace(start = 100, stop = 1200, num = 12)]

# Number of features to consider at every split
max_features = ['auto', 'sqrt']

# Maximum number of levels in tree
max_depth = [int(x) for x in np.linspace(5, 30, num = 6)]

# Minimum number of samples required to split a node
min_samples_split = [2, 5, 10, 15, 100]

# Minimum number of samples required at each leaf node
min_samples_leaf = [1, 2, 5, 10]

random_grid = {'n_estimators': n_estimators,
               'max_features': max_features,
               'max_depth': max_depth,
               'min_samples_split': min_samples_split,
               'min_samples_leaf': min_samples_leaf}


# Random search of parameters, using 5 fold cross validation, search across 100 different combinations
rf_random = RandomizedSearchCV(estimator = RandomForestRegressor(), param_distributions = random_grid,
                               scoring='neg_mean_squared_error', n_iter = 10, cv = 5,
                               verbose=1, random_state=42, n_jobs = 1)
rf_random.fit(X_train,y_train)
- Here we are using RandomizedSearchCV which just randomly tries out combinations and sees which one is the best out of them.
- We have declared the parameters of RandomForestRegressor which we want to try.
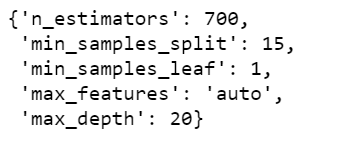
Step 27 – Checking the best parameters we got using Randomized Search CV.
rf_random.best_params_
Step 28 – Taking Predictions
# Flight Price Prediction
prediction = rf_random.predict(X_test)
Step 29 – Plotting the residuals.
plt.figure(figsize = (8,8))
sns.distplot(y_test-prediction)
plt.show()
- As we can see that most of the residuals are 0, which means our model is generalizing well.

Step 30 – Plotting y_test vs predictions.
plt.figure(figsize = (8,8))
plt.scatter(y_test, prediction, alpha = 0.5)
plt.xlabel("y_test")
plt.ylabel("y_pred")
plt.show()
- Simply plotting our predictions vs the true values.
- Ideally, it should be a straight line.

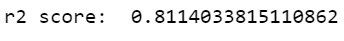
Step 31 – Printing metrics.
print('r2 score: ', metrics.r2_score(y_test,y_pred))
Step 32 – Saving our model.
file = open('flight_rf.pkl', 'wb')
pickle.dump(rf_random, file)
Final Look of our Flight Price Prediction app…

Download Source code and Data for Flight Price Prediction…
Do let me know if there’s any query regarding Flight Price Prediction by contacting me on email or LinkedIn.
So this is all for this blog folks, thanks for reading it and I hope you are taking something with you after reading this and till the next time ?…
Read my previous post: STOCK SENTIMENT ANALYSIS USING HEADLINES
Check out my other machine learning projects, deep learning projects, computer vision projects, NLP projects, Flask projects at machinelearningprojects.net.


Thank you for the tutorial
I really enjoyed it.
I would like to know how I can get a similar flight dataset from my country (Nigeria)?
Check on Kaggle…
Bro gave the Flight price prediction project using