
House Price Prediction Project proves to be the Hello World of the Machine Learning world. It is a very easy project which simply uses Linear Regression to predict house prices. This is going to be a very short blog, so without any further due, Let’s do it…
Checkout the video here – https://youtu.be/Hlr6y6youhI
Step 1 – Importing required libraries.
import pandas as pd
import numpy as np
import matplotlib.pyplot as plt
import seaborn as sns
from sklearn.preprocessing import StandardScaler
from sklearn.model_selection import train_test_split
from sklearn.linear_model import LinearRegression
from sklearn.metrics import r2_score

%matplotlib inline
Step 2 – Reading our input data for House Price Prediction.
customers = pd.read_csv('USA_Housing.csv')
customers.head()

Step 3 – Describing our data.
customers.describe()

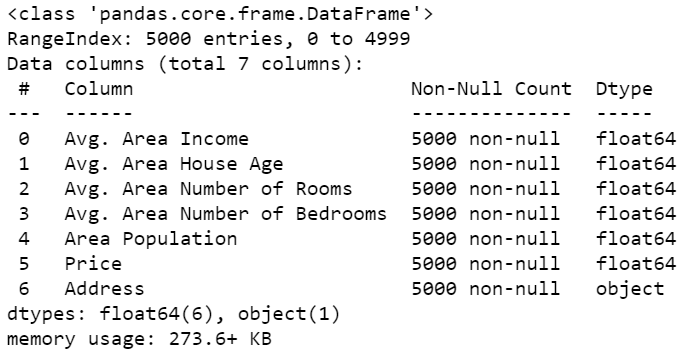
Step 4 – Analyzing information from our data.
customers.info()
Step 5 – Plots to visualize data of House Price Prediction.
sns.pairplot(customers)
- We use sns.pairplot(data) to plot all the possible combinations of numerical columns in the dataset.
- From the plots below we can infer one thing that Price is highly correlated to Average Area Income.

Step 6 – Scaling our data.
scaler = StandardScaler()

X=customers.drop(['Price','Address'],axis=1)
y=customers['Price']

cols = X.columns

X = scaler.fit_transform(X)
- We need to scale our data to bring everything down to one scale or within one range.
- We are using StandardScaler here to scale our data.
- Just check out the 1st image of input data and see how different columns belong to different scales.
Step 7 – Splitting our data for training and test purposes.
X_train, X_test, y_train, y_test = train_test_split(X, y, test_size=0.3, random_state=101)
- Using train_test_split() to split our data in 70%-30% proportions.
Step 8 – Training our Linear Regression model for House Price Prediction.
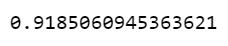
lr = LinearRegression()
lr.fit(X_train,y_train)

pred = lr.predict(X_test)

r2_score(y_test,pred)
- We are using r2_score here to measure the performance of our regression model.
- Our model is giving a 0.91 r2_score out of 1 which is a very decent score.
- I also tried using Lasso and Ridge Regressions but they also performed nearly the same as Linear regression.
Step 9 – Let’s visualize our predictions of House Price Prediction.
sns.scatterplot(x=y_test, y=pred)
- This should be a straight line for a 100% accurate model.
- But we are also getting a trend like a straight line which is also not bad.

Step 10 – Plotting the residuals of our House Price Prediction model.
sns.histplot((y_test-pred),bins=50,kde=True)
- Here we are plotting a histogram of residuals.
- Residual is the error term in a regression, or we can say the difference between the real value and our predicted value.
- As we can see that most of the residuals are around 0 means our predictions are almost near to the real values, hence it is a very good model.

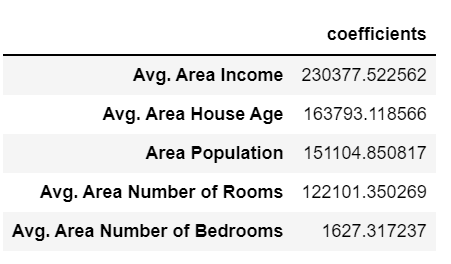
Step 11 – Observe the coefficients.
cdf=pd.DataFrame(lr.coef_, cols, ['coefficients']).sort_values('coefficients',ascending=False)
cdf
- These are the coefficients calculated while Linear Regression.
- Its intuition is that a 1 unit increase in Avg. Area Income will lead to an increase of $230377.522 in the price of the house, assuming all other factors are kept constant.
Download Source Code…
Do let me know if there’s any query regarding this topic by contacting me on email or LinkedIn.
So this is all for this blog folks, thanks for reading it and I hope you are taking something with you after reading this and till the next time…
Read my previous post: WINE QUALITY PREDICTION
Check out my other machine learning projects, deep learning projects, computer vision projects, NLP projects, Flask projects at machinelearningprojects.net.


Can you help me with the dataset
Unzip the source code. It’s inside it 🙂
sir i want house price predication code on python
plzzz send me sir
i have project but code was not run please help me
What’s the error?
Grand merci pour ce projet , cela m’a beaucoup aidé
Can u plzz give me a source code of house price prediction in python bt plzz give error free code