In this very short blog, we will see that how we can plot all 3 color channels histogram (red, green, blue) of an Image in Python using OpenCV.
This is going to be a very interesting blog, so without any further due, Let’s do it…
Checkout the video here – https://youtu.be/GRYIzewAbDg
Step 1 – Importing required packages for plotting Color Channels Histogram.
import cv2
import matplotlib.pyplot as plt
Step 2 – Let’s read and visualize the image.
imgpath = "test.tiff"
img = cv2.imread(imgpath)
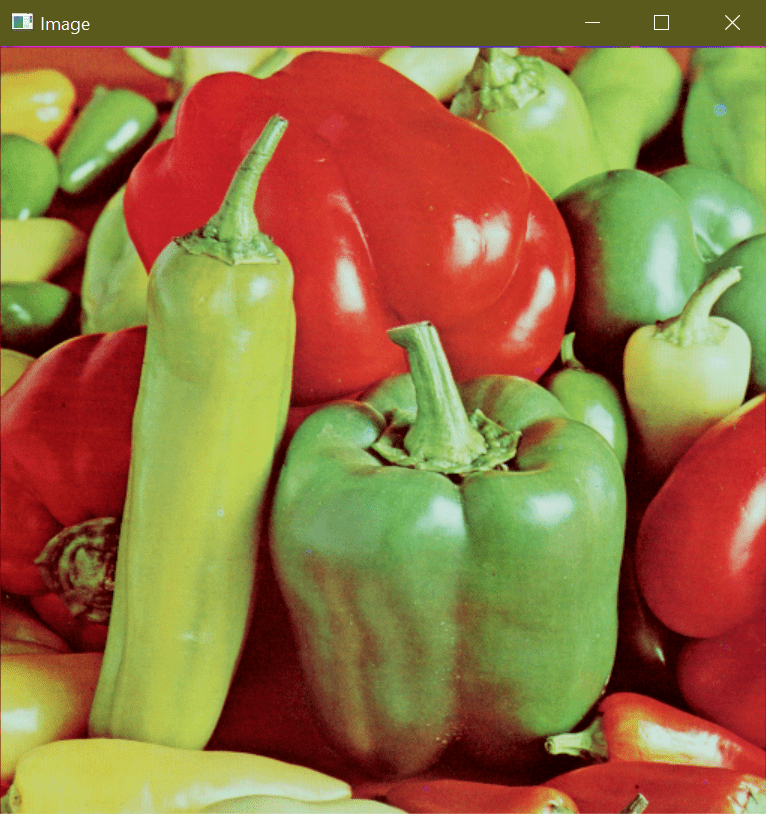
cv2.imshow('Image', img)
cv2.waitKey(0)
Step 3 – Convert the channels from BGR to RGB.
img = cv2.cvtColor(img, cv2.COLOR_BGR2RGB)
Step 4 – Finally let’s get the Color Channels Histograms…
Syntax: cv2.calcHist(images, channels, mask, histSize, ranges[, hist[, accumulate]])
Parameters:
| images | It is the source image of type uint8 or float32 represented as “[img]”. |
| channels | It is the index of the channel for which we calculate the histogram. For a grayscale image, its value is [0] and for a color image, you can pass [0], [1], or [2] to calculate a histogram of blue, green, or red channel respectively. |
| mask | mask image. To find the histogram of the full image, it is given as “None”. |
| histSize | This represents our BIN count. For full scale, we pass [256]. |
| ranges | This is our RANGE. Normally, it is [0,255]. |
red_hist = cv2.calcHist([img], [0], None, [256], [0, 255])
green_hist = cv2.calcHist([img], [1], None, [256], [0, 255])
blue_hist = cv2.calcHist([img], [2], None, [256], [0, 255])
You can read more about Histogram Calculation here.
Step 5 – Let’s plot these color channels histograms.
plt.subplot(4, 1, 1)
plt.imshow(img)
plt.title('image')
plt.xticks([])
plt.yticks([])

plt.subplot(4, 1, 2)
plt.plot(red_hist, color='r')
plt.xlim([0, 255])
plt.title('red histogram')

plt.subplot(4, 1, 3)
plt.plot(green_hist, color='g')
plt.xlim([0, 255])
plt.title('green histogram')

plt.subplot(4, 1, 4)
plt.plot(blue_hist, color='b')
plt.xlim([0, 255])
plt.title('blue histogram')

plt.tight_layout()
plt.show()
- We have created a canvas with 4 rows and 1 column.
- In the first row, we have plotted the image with x and y bars removed using xticks() and yticks().
- In the second row, we have plotted the histogram for the red channel. We have set the limit of the histogram from 0-255 (which is the actual range of the red channel values that every pixel can take).
- We have done a similar thing for green and blue channels also.
- In the second last line, we have used plt.tight_layout() just to provide some spacing between the plots.
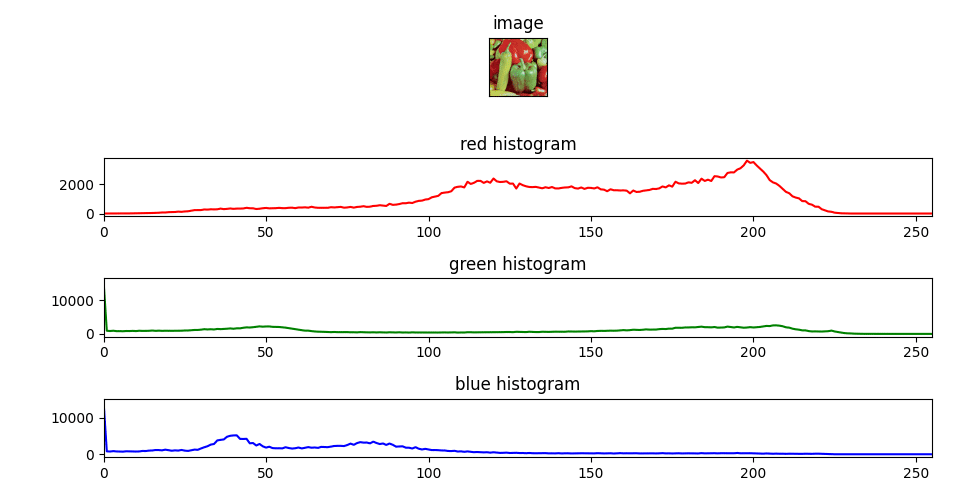
NOTE: From this, we can infer that the major portion of the image is RED.
Let’s see the whole code for plotting Color Channels Histogram…
import cv2
import matplotlib.pyplot as plt

imgpath = "4.2.07.tiff"
img = cv2.imread(imgpath)

cv2.imshow('Image', img)
cv2.waitKey(0)

img = cv2.cvtColor(img, cv2.COLOR_BGR2RGB)

# Color Channels Histogram
red_hist = cv2.calcHist([img], [0], None, [256], [0, 255])
green_hist = cv2.calcHist([img], [1], None, [256], [0, 255])
blue_hist = cv2.calcHist([img], [2], None, [256], [0, 255])

plt.subplot(4, 1, 1)
plt.imshow(img)
plt.title('image')
plt.xticks([])
plt.yticks([])

plt.subplot(4, 1, 2)
plt.plot(red_hist, color='r')
plt.xlim([0, 255])
plt.title('red histogram')

plt.subplot(4, 1, 3)
plt.plot(green_hist, color='g')
plt.xlim([0, 255])
plt.title('green histogram')

plt.subplot(4, 1, 4)
plt.plot(blue_hist, color='b')
plt.xlim([0, 255])
plt.title('blue histogram')

plt.tight_layout()
plt.show()
Do let me know if there’s any query regarding Color Channels Histogram by contacting me on email or LinkedIn.
So this is all for this blog folks, thanks for reading it and I hope you are taking something with you after reading this and till the next time ?…
Read my previous post: HOW TO PERFORM BLURRINGS LIKE SIMPLE BLUR, BOX BLUR, GAUSSIAN BLUR, AND MEDIAN BLUR
Check out my other machine learning projects, deep learning projects, computer vision projects, NLP projects, Flask projects at machinelearningprojects.net.