Hey guys, So here comes the fifth blog of the Handwritten notes series which we started. We will be talking about Linear Regression in this blog. I have uploaded my handwritten notes below and tried to explain them in the shortest and best way possible.
The first blog of this series was NumPy Handwritten Notes and the second was Pandas Handwritten Notes. If you haven’t seen those yet, go check them out.
Let’s go through the Linear Regression notes…
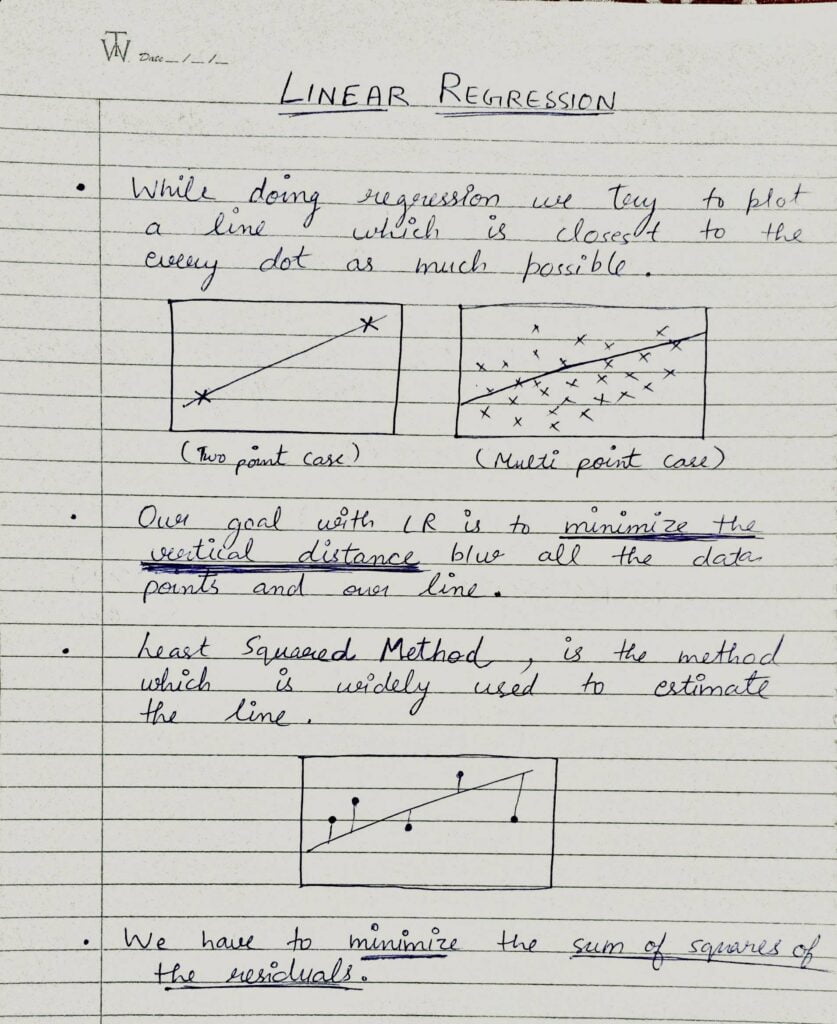
- While doing Linear Regression we try to plot a line that is closest to every point as much as possible.
- Our goal with Linear Regression is to minimize the vertical distance between all the data points and our line.
- The method which is widely used to estimate the line is Least Square Method.
- scikit-learn or better known as sklearn is a library that encapsulates all the Machine Learning classes.
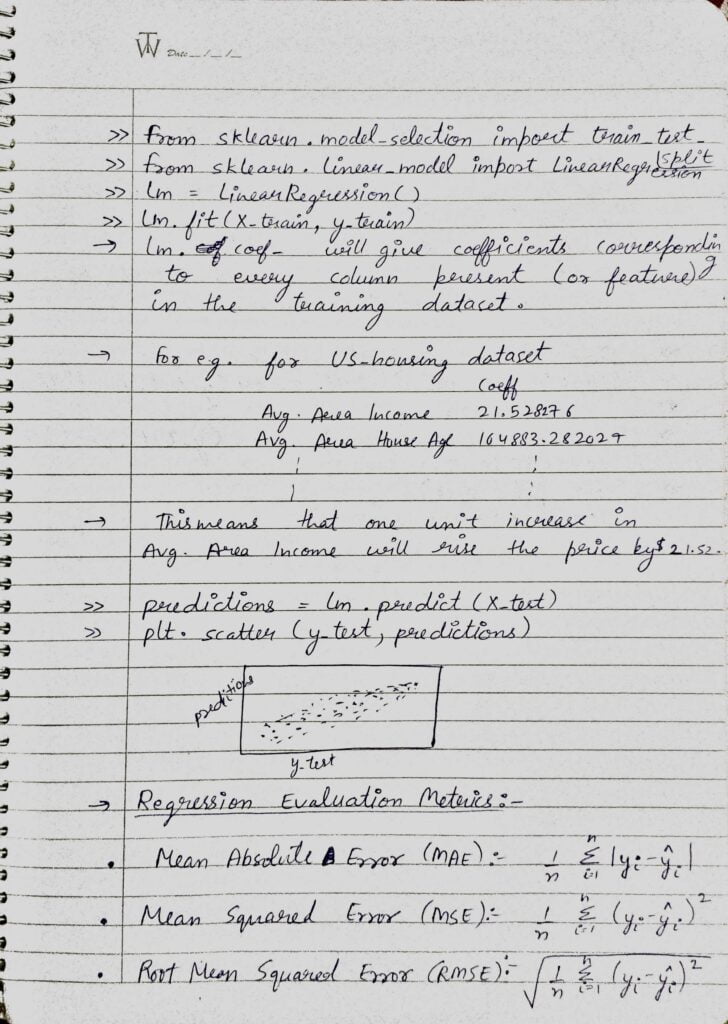
- We can import LinearRegression from sklearn.linear_model class.
- Also here we are importing train_test_split from sklearn.model_selection which is used to split our data in certain proportions for training and testing purposes.
- Then we are simply doing lm = LinearRegression() which will create a LinearRegression class object named lm.
- Then we have to feed training data to this object for the training purpose. We achieve it by doing lm.fit(X_train, y_train).
- If we want to check the contribution of each and every feature towards the target, we can use lm.coef_ which will print the coefficients of each and every feature present in the data.
- Like in the above example, our target is the price of the house and one of our features is the Average Area Income. So when we print coefficients it gives Avg. Area Income as 21.52 which means that 1 unit change in Avg. Area Income will increase the target (House Price) by $21.52.
- We use lm.predict(X_test) to make predictions from our trained model. And then we calculate accuracy by comparing those predictions with y_test.
- There are many metrics which we can use for evaluation a regression model performance but the 3 most widely used are:
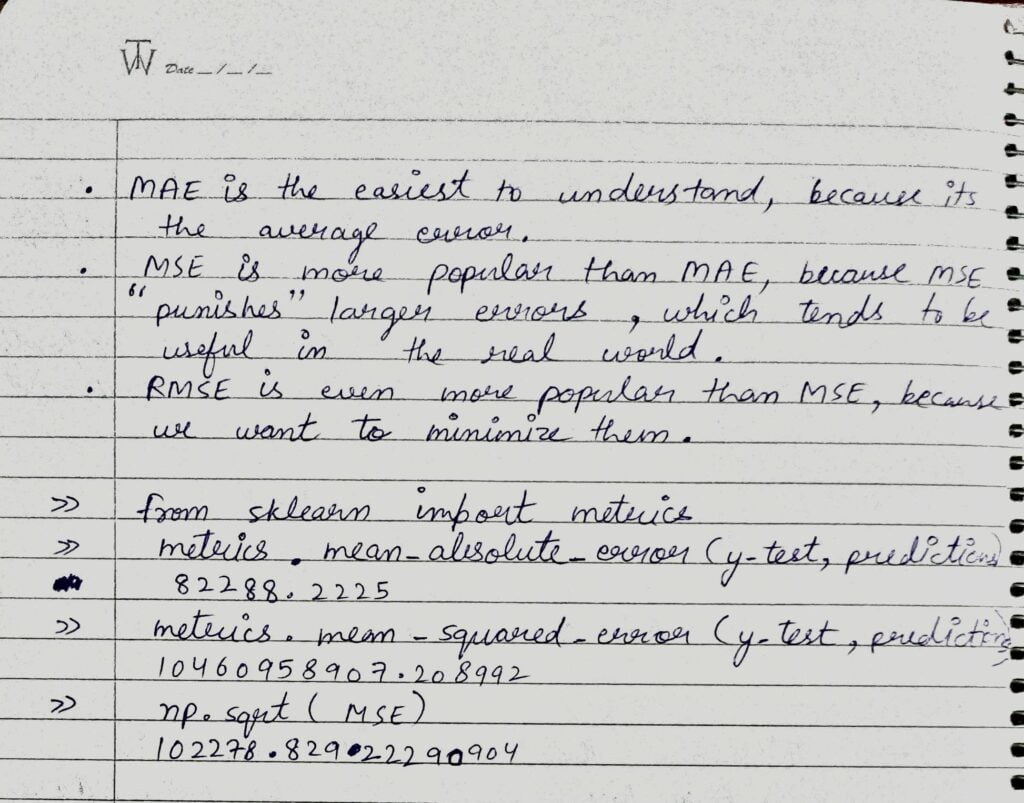
- MAE is the easiest to understand because it’s simply the average error.
- MSE is more popular than MAE because MSE punishes outliers heavily, which tends to be useful in the real-world use cases.
- Most of the time we use RMSE because it further minimizes the MSE.
- We can import MAE and MSE form sklearn.metrics class as sklearn.metrics.mean_absolute_error and sklearn.metrics.mean_squared_error.
- For RMSE we just use np.sqrt(MSE).
Do let me know if there’s any query regarding Linear Regression by contacting me on email or LinkedIn.
So this is all for this blog folks, thanks for reading it and I hope you are taking something with you after reading this and till the next time ?…
READ MY PREVIOUS BLOG: SEABORN – LAST-MINUTE NOTES – HANDWRITTEN NOTES
Check out my other machine learning projects, deep learning projects, computer vision projects, NLP projects, Flask projects at machinelearningprojects.net.