Hey guys, So here comes the third blog of the Handwritten notes series which we started. We will be talking about Matplotlib in this blog. I have uploaded my handwritten notes below and tried to explain them in the shortest and best way possible.
The first blog of this series was NumPy Handwritten Notes and the second was Pandas Handwritten Notes. If you haven’t seen those yet, go check them out.
Let’s go through the Matplotlib notes…
- We can plot plots through Matplotlib using 2 ways.
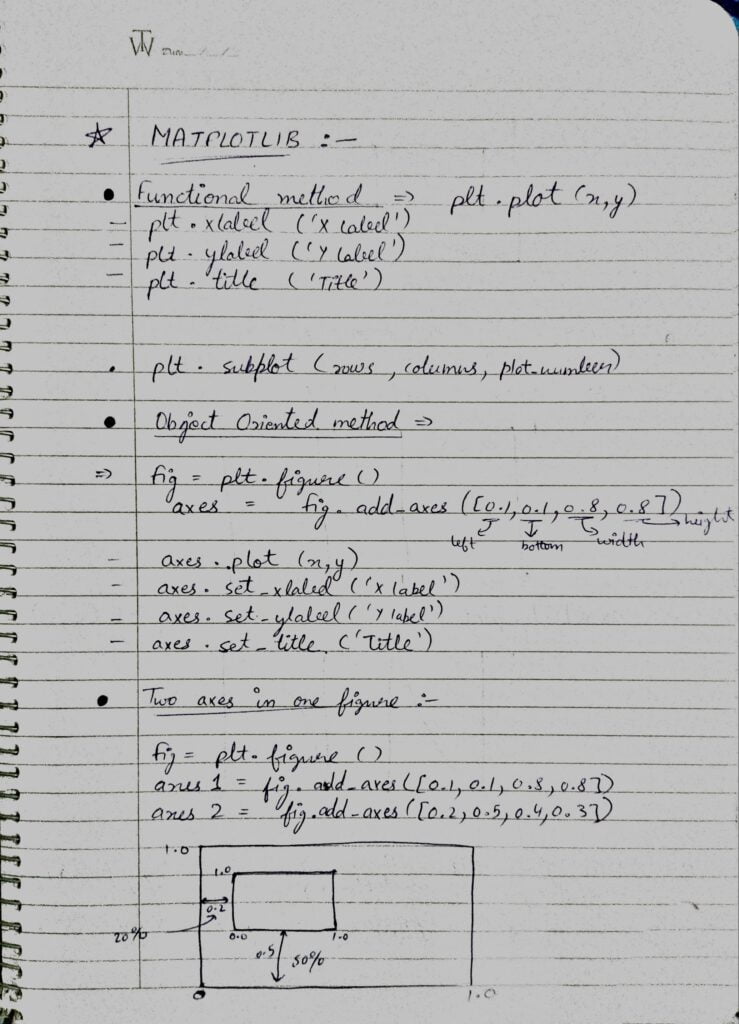
- Functional method.
- Object Oriented method.
- Functional methods are the inbuilt methods. These are not much flexible.
- Whereas the Object oriented methods are defined by users. These are very flexible.
- In functional method we just used plt.plot(x,y) which as we can see is not providing us with much access to the location or orientation of plot.
- But in Object oriented method we first of all declared a figure. Then added two axes in it.
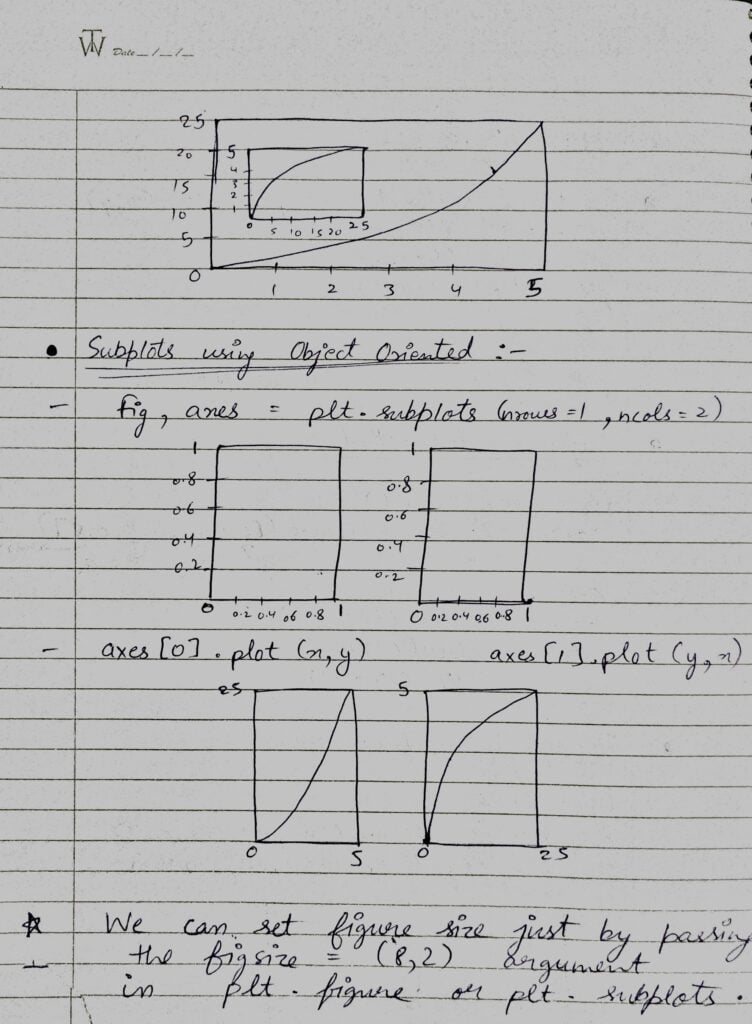
- Here we are plotting subplots using the object oriented method.
- plt.subplots(n_rows,n_cols) will return two objects first is the figure and second is an array of size n_rows*n_cols. Where every element depicts the axes object.
- To plot on the first plot we will do axes[0].plot(x,y).
- We can also set figure size by passing figsize parameter in plt.figure() or plt.subplots().
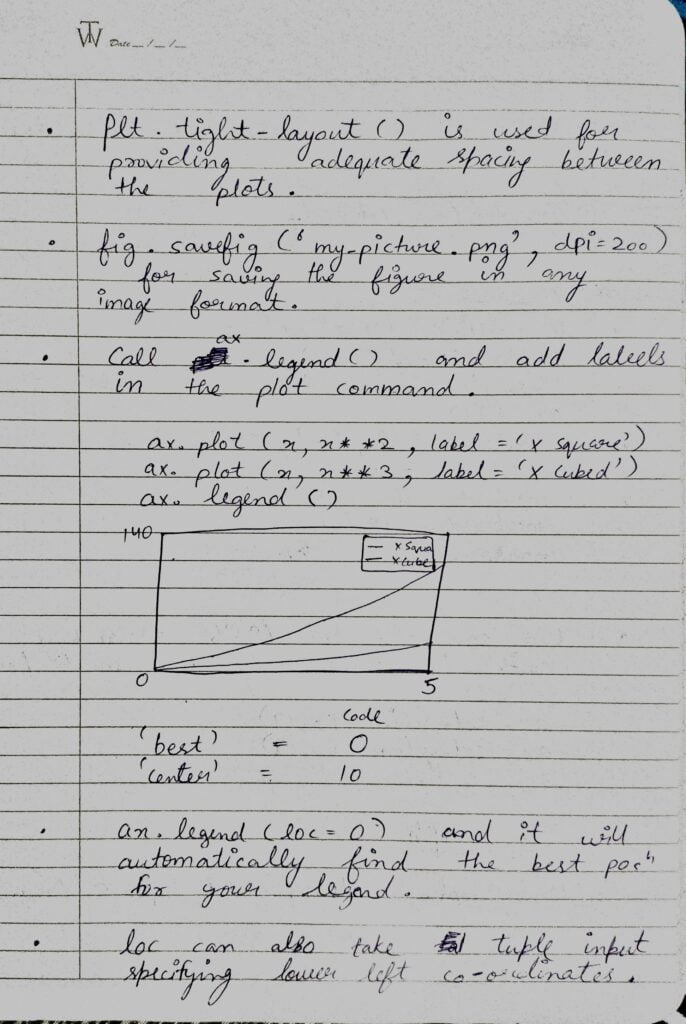
- We use plt.tight_layout() to provide adequate spacing between the plots.
- We can also save plots in image format using fig.savefig(filename, dpi).
- When plotting more than one plots in one figure we can use labels to distinguish between them.
- And to show these labels we finally use ax.legend() in the end.
- loc=0 will find the best location for the labels in the plot.
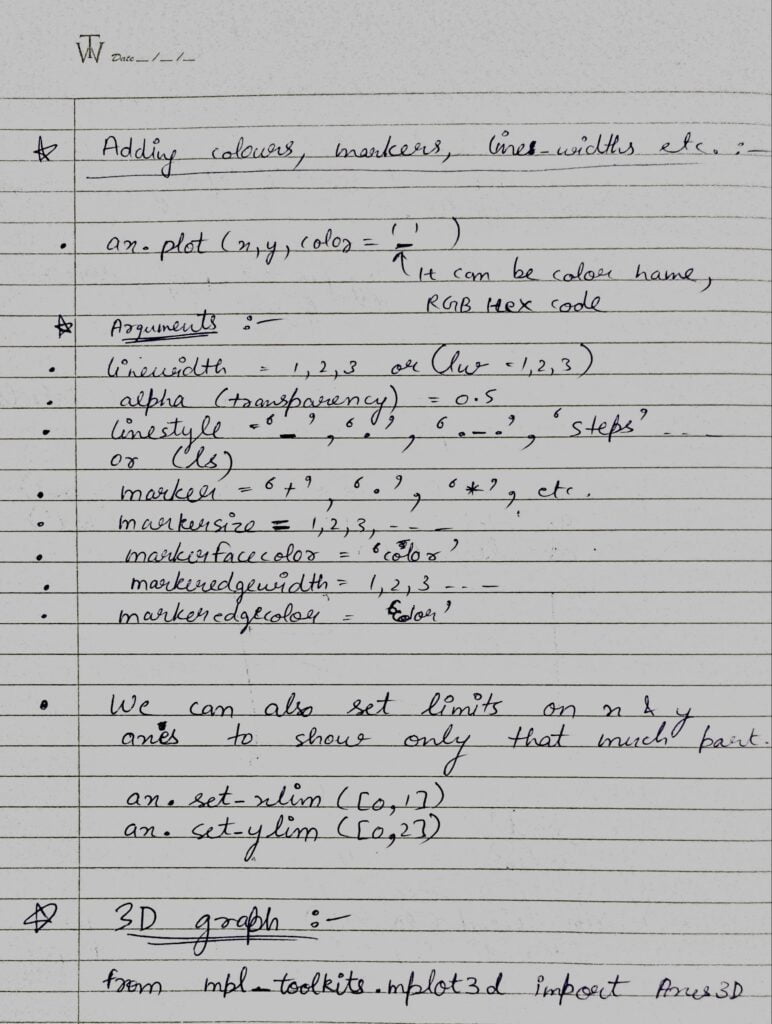
- We can customize the plots in any way possible by changing colors, marker, size, etc.
- We pass color parameter to set color of the curve. color can be color name or hex code.
- We pass linewidth parameter to set the width of the curve.
- We pass alpha parameter to set the transparency of the curve.
- We pass linestyle/ls parameter to set the line style of the curve. It can be ‘____’ , ‘….’ , ‘._._._.’ , etc.
- We pass marker parameter to set the markers of the curve. It can be ‘+’ , ‘.’ , ‘*’ , etc.
- We pass markersize parameter to set the size of the markers of the curve. It can be 1, 2, 3, etc.
- We pass markerfacecolor parameter to set the color of the face of the markers of the curve.
- We pass markeredgewidth parameter to set the size of the edge of the markers of the curve. It can be 1, 2, 3, etc.
- We pass markeredgecolor parameter to set the color of the edge of the markers of the curve.
Do let me know if there’s any query regarding Matplotlib by contacting me on email or LinkedIn.
So this is all for this blog folks, thanks for reading it and I hope you are taking something with you after reading this and till the next time ?…
Check out my other machine learning projects, deep learning projects, computer vision projects, NLP projects, Flask projects at machinelearningprojects.net.