Today’s blog is going to be a very simple and short blog where we will see how we can input an image and split and merge channels in cv2.
This is going to be a very interesting blog, so without any further due, Let’s do it…
Step 1 – Import the libraries.
import cv2
import matplotlib.pyplot as plt
Step 2 – Reading and converting the image.
img = cv2.imread('test.jpg')
img = cv2.cvtColor(img, cv2.COLOR_BGR2RGB)

Step 3 – Let’s check the shape of our input image.
print('Shape of input image --> ', img.shape)

- Here we can see that our input image is made up of 3 channels (RGB) each of size 194 X 259.
- We will be splitting them in the next step
Step 4 – Let’s split and merge channels in cv2.
r, g, b = cv2.split(img)
- cv2.split(img) splits image into individual channels.
- Here our image is made of 3 channels RGB, that’s why it is returning 3 values.
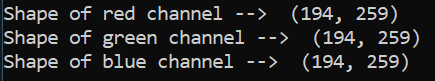
Step 5 – Let’s check the shape of individual channels.
print('Shape of red channel --> ', r.shape)
print('Shape of green channel --> ', g.shape)
print('Shape of blue channel --> ', b.shape)
Step 6 – Let’s plot the results.
images = [cv2.merge((r, g, b)), r, g, b]

plt.subplot(2, 2, 1)
plt.xticks([])
plt.yticks([])
plt.imshow(images[0])
plt.title('original')

plt.subplot(2, 2, 2)
plt.xticks([])
plt.yticks([])
plt.imshow(images[1], cmap='Reds')
plt.title('red')

plt.subplot(2, 2, 3)
plt.xticks([])
plt.yticks([])
plt.imshow(images[2], cmap='Greens')
plt.title('green')

plt.subplot(2, 2, 4)
plt.xticks([])
plt.yticks([])
plt.imshow(images[3], cmap='Blues')
plt.title('blue')

plt.show()
- cv2.merge() is the exact opposite of the cv2.split().
- It merges all the channels given as arguments.

Let’s see the whole code…
import cv2
import matplotlib.pyplot as plt

img = cv2.imread('test.jpg')
img = cv2.cvtColor(img, cv2.COLOR_BGR2RGB)

print('Shape of input image --> ', img.shape)

r, g, b = cv2.split(img)

print('Shape of red channel --> ', r.shape)
print('Shape of green channel --> ', g.shape)
print('Shape of blue channel --> ', b.shape)

images = [cv2.merge((r, g, b)), r, g, b]

plt.subplot(2, 2, 1)
plt.xticks([])
plt.yticks([])
plt.imshow(images[0])
plt.title('original')

plt.subplot(2, 2, 2)
plt.xticks([])
plt.yticks([])
plt.imshow(images[1], cmap='Reds')
plt.title('red')

plt.subplot(2, 2, 3)
plt.xticks([])
plt.yticks([])
plt.imshow(images[2], cmap='Greens')
plt.title('green')

plt.subplot(2, 2, 4)
plt.xticks([])
plt.yticks([])
plt.imshow(images[3], cmap='Blues')
plt.title('blue')

plt.show()
NOTE – Read more about the split and merge channels in cv2 here.
Do let me know if there’s any query regarding split and merge channels in cv2 by contacting me on email or LinkedIn.
So this is all for this blog folks, thanks for reading it and I hope you are taking something with you after reading this and till the next time ?…
Read my previous post: HOW TO PERFORM EDGE DETECTION USING SOBEL X AND SOBEL Y IN PYTHON USING OPENCV
Check out my other machine learning projects, deep learning projects, computer vision projects, NLP projects, Flask projects at machinelearningprojects.net.