Hey guys, in this blog we will see some of the very important Data Science Notes that you can go through before going to an Interview.
Data science is a rapidly evolving field that combines statistics, programming, and domain expertise to extract valuable insights from large and complex datasets. Whether you’re a student preparing for an exam, a professional seeking a quick refresher, or an aspiring data scientist looking to solidify your knowledge, having concise and effective last-minute notes can be immensely helpful.
In this article, we will provide you with a comprehensive set of last-minute data science notes to ensure you’re well-prepared for your upcoming data science endeavors.
So without any further due, let’s do it…
A
Adjusted R Squared
Adjusted R-squared is a modified version of R-squared that has been adjusted for the number of predictors in the model. The adjusted R-squared increases when the new term improves the model more than would be expected by chance. It decreases when a predictor improves the model by less than expected.
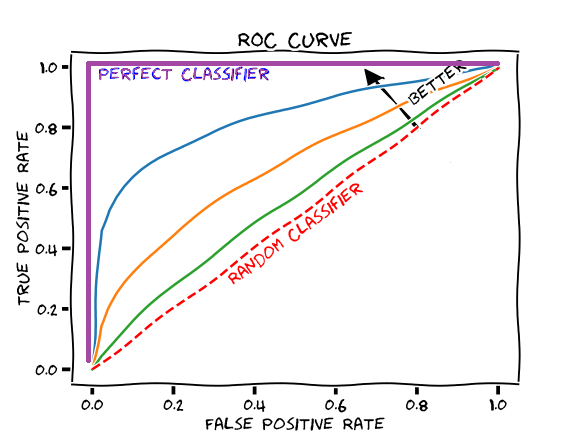
AUC-ROC Curve
“Area Under the Curve” (AUC) of “Receiver Characteristic Operator” (ROC)curve is a special type of curve that is used to check the performance of a classification model. It basically tells how well our model is differentiating between True Positives and False Positives. AUC-ROC curve is plotted between True Positive rate and False Positive rate.
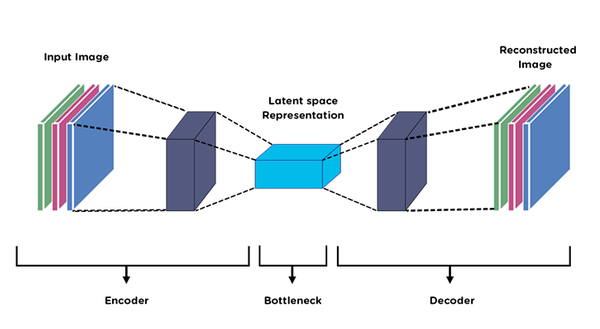
Autoencoders
Autoencoders are a special type of neural network which just tries to produce the output, the same as the input. This means the input we are feeding the network is the output we are expecting from that network. Autoencoders are also used in the dimensionality reduction use case.
B
Backpropagation
Backpropagation, short for “backward propagation of errors,” is an algorithm for supervised learning of artificial neural networks using gradient descent. Given an artificial neural network and an error function, the method calculates the gradient of the error function with respect to the neural network’s weights. It helps in optimizing our model by updating the weights and biases of our network.
Backward Elimination
Backward elimination is a feature selection technique while building a machine learning model. It is used to remove those features that do not have a significant effect on the dependent variable or prediction of output.
Bagging
Bagging, also known as bootstrap aggregation, is the ensemble learning method that is commonly used to reduce variance within a noisy dataset. In bagging, a random sample of data in a training set is selected with replacement—meaning that the individual data points can be chosen more than once. After several data samples are generated, these weak models are then trained independently, and depending on the type of task—regression or classification, for example—the average or majority of those predictions yield a more accurate estimate. The most commonly used Bagging algorithm is Random Forest.
Batch Normalization
Batch normalization is a method used to make artificial neural networks faster and more stable through normalization of the layers’ inputs by re-centering and re-scaling.
Binary Cross-Entropy
Binary cross entropy compares each of the predicted probabilities to actual class output which can be either 0 or 1. It then calculates the score that penalizes the probabilities based on the distance from the expected value.
Bivariate
Bivariate analysis is one of the simplest forms of quantitative (statistical) analysis. It involves the analysis of two variables (often denoted as X, Y), for the purpose of determining the empirical relationship between them.
Blurring
Blurring is a widely used Image Processing technique. The major idea of blurring is to remove high-frequency noise from it and make it as smooth as possible. Some examples of Blurrings are Gaussian Blur, Median Blur, Box Blur, etc.

Boosting
In machine learning, boosting is an ensemble learning algorithm for primarily reducing bias, and also variance in supervised learning, and a family of machine learning algorithms that convert weak learners to strong ones. It sees for data points that were incorrectly classified in the previous learner and assign a higher probability to these data points for getting picked in the next learner so that the next learner can properly learn about that data point and in this way we are combining different weak learners to create one strong learner.
C
C parameter in SVM
In simple words, C is a hyperparameter that is set prior to train an SVM model. C controls the error rate. High C means high error, low C means low error. But that doesn’t mean that the low C SVM model always gives the best results because that model may not generalize well.
Categorical Cross-Entropy
Categorical cross-entropy is a loss function that is used in multi-class classification tasks. These are tasks where an example can only belong to one out of many possible categories, and the model must decide which one. Formally, it is designed to quantify the difference between two probability distributions.
Central Limit Theorem
The central limit theorem states that if we take the mean of any number of sample means (let’s say 100), then that value will be approximately equal to our population mean. For Central Limit Theorem to hold the sample size should be at least 30 or greater.
Checkpoint
Checkpoint is a callback used while training the model in Keras. It keeps on saving the model after every epoch and also saves the best model.
Classification
Classification is a type of problem in which we have discrete output classes. The output can not be in continuous numerical form. Examples of a classification model are given height and weight to predict whether it is a dog or a horse.
Classification Report
The classification report visualizer displays the precision, recall, F1, and support scores for the model.
Collaborative Filtering
In the newer, narrower sense, collaborative filtering is a method of making predictions (filtering) about the interests of a user by collecting preferences or taste information from many users (collaborating).
Collinearity
Collinearity refers to a problem when running a regression model where 2 or more independent variables have a strong linear relationship.
Computer Vision
Computer vision is a field of artificial intelligence (AI) that enables computers and systems to derive meaningful information from digital images, videos, and other visual inputs — and take actions or make recommendations based on that information.
Confusion Matrix
A confusion matrix is a technique for summarizing the performance of a classification algorithm. Classification accuracy alone can be misleading if you have an unequal number of observations in each class or if you have more than two classes in your dataset.

Content-Based Filtering
In content-based filtering recommender systems, the recommendations are made on the basis of similarity between the items and not on the basis of user behavior.
Convolutional Neural Networks
In deep learning, a convolutional neural network is a class of artificial neural networks, most commonly applied to analyze visual imagery. As the name suggests it performs the convolution operation on the images and extracts useful information out of them.
Correlation
Correlation refers to the linear relationship between 2 variables. Correlation can be both positive and negative. A positive correlation means if one variable is going in one direction other is also going in the same direction. A negative correlation means if one variable is going in one direction, the other is going in the opposite direction.
Cosine Similarity
Cosine similarity is the cosine of the angle between two n-dimensional vectors in an n-dimensional space. It is the dot product of the two vectors divided by the product of the two vectors’ lengths (or magnitudes).
Cost Function
A cost function is that type of function whose value increase when our model becomes worse and its value decreases when our model becomes better.
Covariance
In probability theory and statistics, covariance is a measure of the joint variability of two random variables.
D
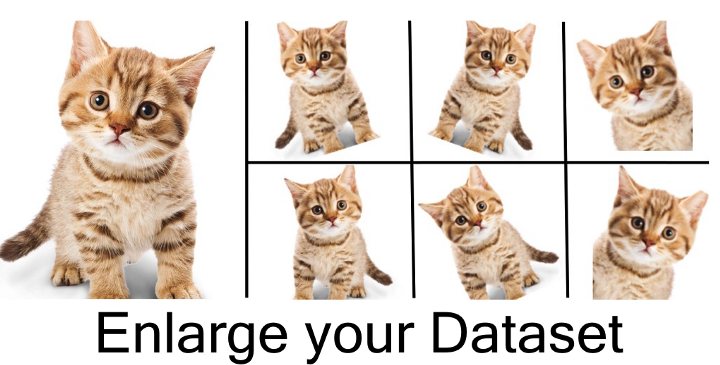
Data Augmentation
Data Augmentation is an operation that helps us to enlarge our images dataset by performing some operations on our images. Some of the widely used operations are rotation, shearing, zooming, horizontal flipping, vertical flipping, etc.
Data Science
Data science is an interdisciplinary field that uses scientific methods, statistics, algorithms, and systems to extract knowledge and hidden insights from noisy, structured, or unstructured data, and apply knowledge and actionable insights from data across a broad range of application domains.
Dataframe
A Pandas Data frame is a two-dimensional data structure, i.e., data is aligned in a tabular fashion in rows and columns. We can also think of Dataframe as a combination of many Series objects.

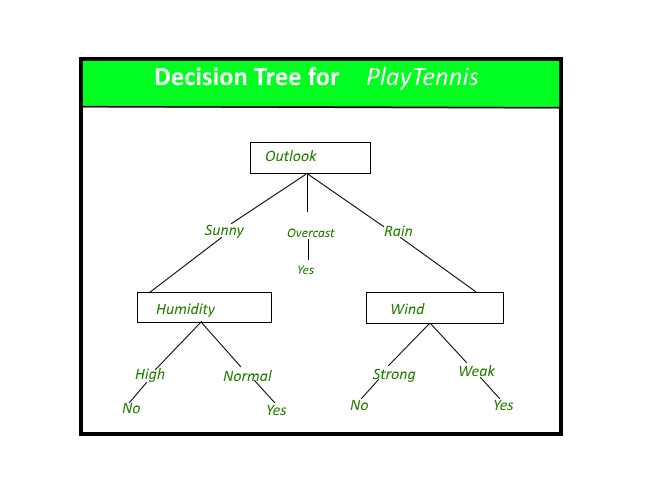
Decision Tree
A decision tree is a flowchart-like structure in which each internal node represents a “test” on an attribute (e.g. whether a coin flip comes up heads or tails), each branch represents the outcome of the test, and each leaf node represents a class label (decision taken after computing all attributes). It is used for both Classification and Regression problems.
Deep Learning
Deep learning is a type of machine learning and artificial intelligence (AI) that imitates the way humans gain certain types of knowledge. While traditional machine learning algorithms are linear, deep learning algorithms are stacked in a hierarchy of increasing complexity. Its name came from the fact that these networks are really very deep containing 10 or 20 or 30 or even more hidden layers of neurons.
Dummy Variables
A dummy variable is a numerical variable used in regression analysis to represent different classes of a feature in your data. These are basically 0s and 1s.

E
EarlyStopping
Early stopping is a method that allows you to specify an arbitrarily large number of training epochs and stop training once the model performance stops improving on the validation dataset. We can also define patience in Earlystopping which says that wait for eg. 3 epochs before stopping.
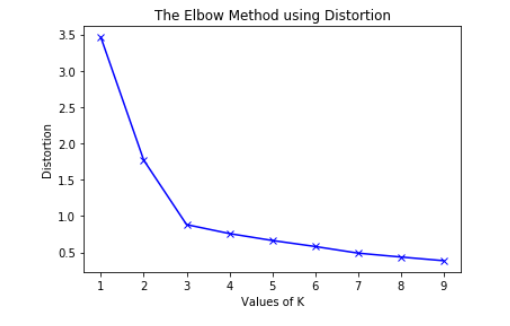
Elbow method
In cluster analysis, the elbow method is a heuristic used in determining the number of clusters in a data set. The method consists of plotting the number of clusters on the x-axis and the within sum of squares of residuals on the y axis. Then we see that on which value of k is the within the sum of squares is showing abrupt change forming an elbow-like structure. We choose this k as our final k.
Embeddings
Embedding is just a fancy name for a vector in an n-dimensional space. In ML, Embeddings play a very vital role. While doing NLP we often need to convert words into Embeddings to check for their dependencies or similarities with other words. While doing Computer Vision also, we need to convert image features from CNN layers to embeddings for finding similarities. Cosine Similarity is the most widely used similarity function.

Entropy
Entropy basically tells us about the randomness in the data. Higher the entropy, the higher the randomness. Entropy is basically used in building Decision Trees using the ID3 algorithm.
Epochs
The number of times we want our model to train on the whole dataset is called epochs. As soon as our model under training sees our whole data, one epoch is completed.
Exploding Gradient
Exploding gradients are a problem where large error gradients accumulate and result in very large updates to neural network model weights during training. This has the effect of your model is unstable and unable to learn from your training data.
F
Fast R-CNN
- Fast R-CNN is an advanced version of R-CNN and was comparatively faster.
- This also used Selective Search but that extra Region Proposal Network is removed.
- Image is directly being fed to the CNN and selective search was used in the produced filters to propose regions.
Faster R-CNN
- Removed Selective Search method.
- It is very fast and can be used in real-time.
- A separate network was used for region proposals.
Fine Tuning
- Remove the fully connected nodes at the end of the network (i.e., where the actual class label predictions are made).
- Replace the fully connected nodes with freshly initialized ones.
- Freeze earlier CONV layers earlier in the network (ensuring that any previous robust features learned by the CNN are not destroyed).
- Start training, but only train the FC layer heads.
- Optionally unfreeze some/all of the CONV layers in the network and perform a second pass of training.
Forward Selection
Forward selection is a type of feature selection technique used while building machine learning models. It begins with an empty model and adds in variables one by one in each forward step, which gives the single best improvement to your model.
G
Gamma Parameter in SVM
In simple words, the Gamma parameter controls the extent of curvatures in the hyperplane.
Generative adversarial network (GAN)
A generative adversarial network (GAN) when given a training set, learns to generate new data with the same statistics as the training set. For example, a GAN trained on photographs can generate new photographs that look at least superficially authentic to human observers, having many realistic characteristics. Two networks Generator and Discriminator compete against each other. The role of the Generator is to generate real-looking fake images and the role of the discriminatory is to detect the fake images generated by the generator.

Gini index
Gini Index, also known as Gini impurity, calculates the amount of probability of a specific feature that is classified incorrectly when selected randomly. The value of 0.5 of the Gini Index shows an equal distribution of elements over some classes.
Gradient Ascent
Gradient descent is a first-order iterative optimization algorithm for finding a local maximum of a differentiable function. The idea is to take repeated steps in the same direction of the gradient (or approximate gradient) of the function at the current point because this is the direction of the highest ascent.
Gradient Descent
Gradient descent is a first-order iterative optimization algorithm for finding a local minimum of a differentiable function. The idea is to take repeated steps in the opposite direction of the gradient (or approximate gradient) of the function at the current point because this is the direction of steepest descent.
H
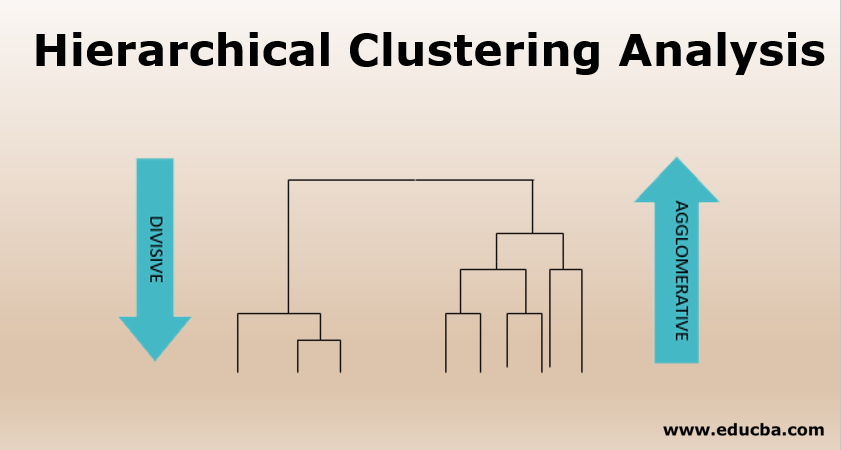
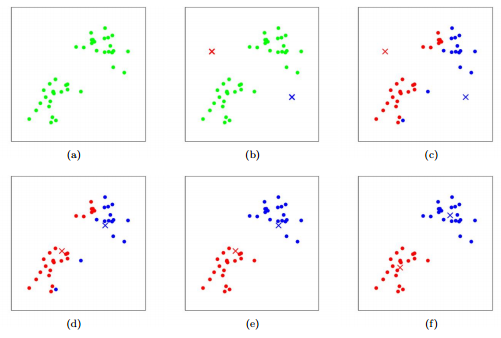
Hierarchical Clustering
Hierarchical clustering, also known as hierarchical cluster analysis, is an algorithm that groups similar objects into groups called clusters. The endpoint is a set of clusters, where each cluster is distinct from the other cluster, and the objects within each cluster are broadly similar to each other. It is of 2 types:
- Agglomerative Hierarchical Clustering: In this type of Clustering, we are present with separate data points (considered as seperate clusters) and we keep on combining them based on some similarity between them. Means we are aggregating clusters in this type of clustering.
- Divisive Hierarchical Clustering: In this type of clustering we start with one cluster containg all the data points and we keep on dividing the clusters on and on till some level of homogenity is achieved. Means we are dividing clusters in this type of clustering.
HSV color space
Like RGB(Red Green Blue) color space, HSV(Hue Saturation Value) color space is also very widely used. It is basically used when we want the range of the colors.
Hyperparameters
Hyperparameters are those parameters of a Neural Network that we set prior to training. For eg. learning rate, decay rate, epochs, batch size, momentum coefficient, etc.
Hypothesis Testing
In Hypothesis testing, we perform various tests to accept or reject a null hypothesis based on the evidence that we collect. Here evidence refer to the data. A Null hypothesis is an initial assumption that we make. The exact opposite of the Null Hypothesis is Alternate Hypothesis. When we can’t accept Null Hypothesis in that case we have to accept the Alternate Hypothesis. Suppose if our Null Hypothesis is ‘It will rain today’ our Alternate hypothesis will be ‘It will not rain today’. Some of the commonly performed tests are the ANOVA test, T-Test, Chi-Square Test, etc.
I
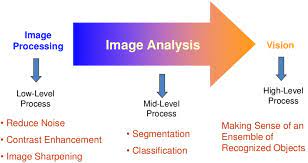
Image Processing
Image Processing (IP) is a computer technology applied to images that help us process, analyze and extract useful information from images which most of the time are further used in Computer Vision use cases. Some of the widely used Image Processing operations are Blurring, Thresholding, Edge Detection, grayscaling, etc.
Information Gain
Information gain is the reduction in entropy by transforming a dataset and is often used in training decision trees. Information gain is calculated by comparing the entropy of the dataset before and after a transformation/split. Suppose at the second level the Entropy is 0.5 and after a split for the third level, the entropy at the third level becomes 0.1, then the entropy is reduced and information is gained out of that and that is equal to 0.5-0.1=0.4.
Inter Quartile Range
Where a range is a measure of where the beginning and end are in a set, an interquartile range is a measure of where the bulk of the values lie. That’s why it’s preferred over many other measures of spread when reporting things like school performance or SAT scores. Its formula is Q3-Q1 where Q3 is the third quartile and Q1 is the first Quartile.
Inverse Document Frequency
Like Term document frequency is the count of the term/word in the current document, inverse document frequency is 1/(the frequency of the word in the whole corpus). Because some stopwords like ‘a’, ‘the’ have very high term frequency, so our model will think that these are very important terms, and that’s why to counter this we multiply it with 1/IDF.
K
Kernel in SVM
A Kernel is used in SVM when we need to take Non-Linear data into a higher dimension space so as to make it easier to classify the data where it could be linearly divided by a plane. Or simply saying Kernels are used to take data (that are non-linearly separable) into higher dimensions.
KMeans
KMeans is an unsupervised learning clustering algorithm which when given some data tries to cluster it in k clusters in the best way possible so as the minimize the within the sum of squares. The within the sum of squares is the sum of squares of the distance between cluster center and data points.
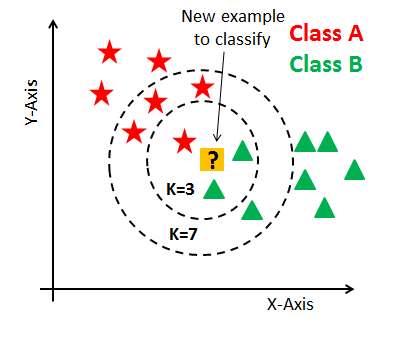
K Nearest Neighbors
K Nearest neighbors also known as KNN is a supervised learning algorithm. It is a lazy algorithm which means it does not learn any discriminative function while the training phase. At the time of prediction, when we give it a data point and ask it to predict its class, it will just see for the nearest k values(k value is passed by the user while training process) and will return the majority value as the prediction.
L
Lasso Regression (L1 regularization)
In Lasso regression, we add an extra term to our Cost Function which is Lambda * (Sum of Absolute values of magnitudes of weights). In this we if any weight value becomes very high (overfitting happens in this case), our total cost also increases, and hence in this way we prevent our model from overfitting. It is also called L1 regularization. We have one more type of regularization which is widely used and that is Ridge Regression or L2 regularization.
Learning Rate
The learning rate is a hyperparameter that controls how much to change the model in response to the estimated error each time the model weights are updated. It is depicted by the ‘η’ (eta) symbol.
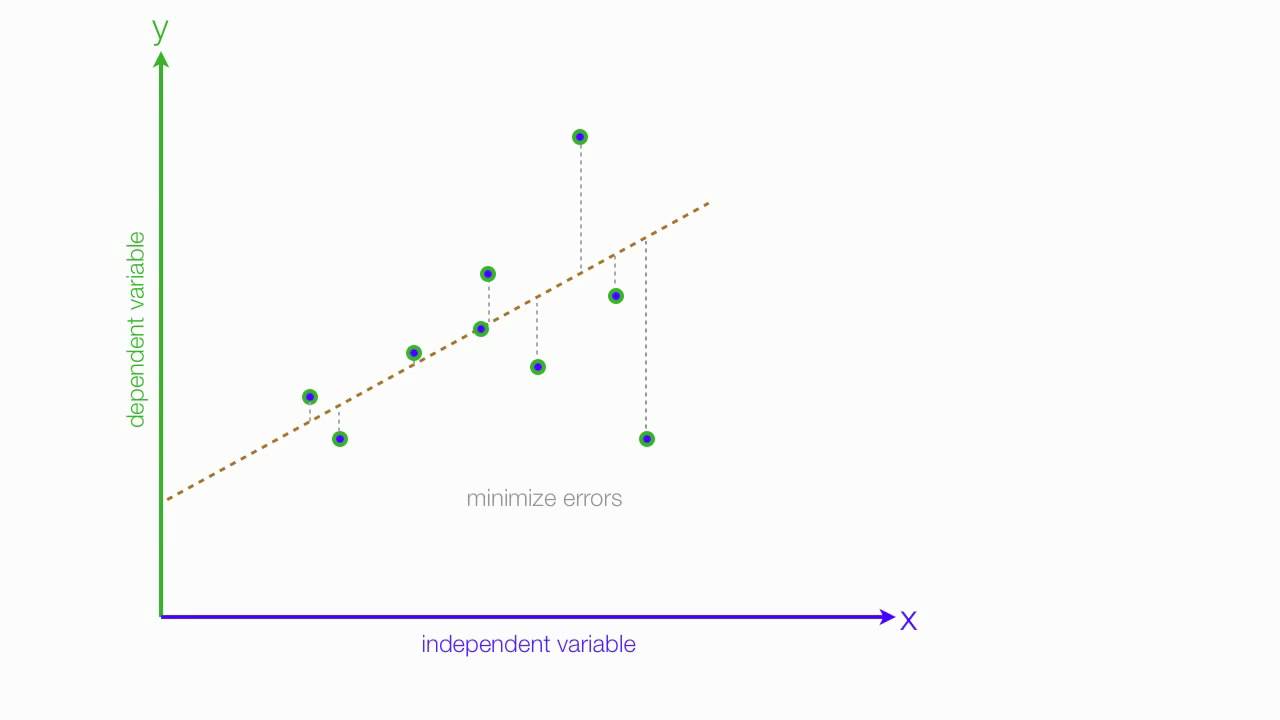
Linear Regression
While doing Linear Regression we try to fit a line of best fit to the data. Or we can say that we try to plot a line that is closest to every data point as much as possible.
Logistic Regression
Logistic regression is a supervised learning binary classification algorithm used to predict the probability of a target variable. It is one of the simplest ML algorithms that can be used for various classification problems such as spam detection, Diabetes prediction, cancer detection, etc. It can also be thought of as the classification version of Linear Regression that uses a special S-shaped curve known as the Sigmoid function.
M
Machine Learning
Machine Learning is a field of Artificial Intelligence that uses statistical techniques to give computers the ability to learn from data, without being explicitly programmed.
Margin in SVM
The distance from the decision surface or the hyperplane to the closest data point(support vector) determines the margin of the classifier.
Mean
In mathematics and statistics, the arithmetic mean, or simply the mean or the average, is the sum of a collection of numbers divided by the count of numbers in the collection.
Mean Absolute Error
- Subtract predicted values from targets.
- Find the absolute value of each difference from Step 1.
- Add up all of the values from Step 2.
- Divide Step 3 by the number of measurements.
Mean Squared Error
- Subtract predicted values from targets and square it.
- Add up all of the values from Step 1.
- Divide Step 2 by the number of measurements.
Median
In statistics and probability theory, the median is the value separating the higher half from the lower half of a data sample, a population, or a probability distribution. For a dataset of n values where n is odd, the n/2th value is the median of that data. And in the case of even n, we add middle 2 numbers and divide that by 2.
Mode
In statistics and probability theory, the mode is the number or numbers that occur the most frequently. Or in simple words, the number which is occurring the maximum number of times in our data is the mode of our data.
Multiple Linear Regression
Like in Linear regression, our dependent variable y is just dependent on 1 independent variable x (y = mx+c), similarly, in Multiple regression, our dependent variable y is dependent on multiple independent variables x1, x2, x3, etc (y = m1x1+m2x2+m3x3+…).
Multivariate
Multivariate analysis (MVA) is a Statistical procedure for the analysis of data involving more than two features. It may also mean solving problems where more than one dependent variable is analyzed simultaneously with other variables.
N
N-Fold Cross-Validation
N fold cross-validation is a technique that we use when we are available with comparatively small datasets. Suppose we have 1100 data points and we want to train our model on that. Out of those 1100, we will keep 100 for testing purposes and 1000 for training and validation purposes. Now, let’s divide these 1000 data points into 10 groups of 100 each.
Now what we will do is we will keep the 1st chunk of 100 for validation and we will train our model on the other 9 chunks. The second time we will do is, we will keep 2nd chunk for validation and the other 9 for training and we will keep on moving like this. In this case, N was 10.
Naive Bayes
Naïve Bayes is one of the fast and easy ML algorithms to predict a class of datasets. It can be used for Binary as well as Multi-class Classifications. It performs well in Multi-class predictions as compared to the other Algorithms. It is the most popular choice for text classification problems. The naïve assumption it assumes is that every feature is independent of each other.
Named Entity Recognition
Named-entity recognition is a subtask of information extraction that seeks to locate and classify named entities mentioned in unstructured text into pre-defined categories such as person names, organizations, locations, medical codes, time expressions, quantities, monetary values, percentages, etc.

Natural Language Processing
Natural language processing is a subfield of linguistics, computer science, and artificial intelligence concerned with the interactions between computers and human language, in particular how to program computers to process and analyze large amounts of natural language data.
Neural Networks
A neural network is a series of algorithms that endeavors to recognize underlying relationships in a set of data through a process that mimics the way the human brain operates. In this sense, neural networks refer to systems of neurons, either organic or artificial in nature.

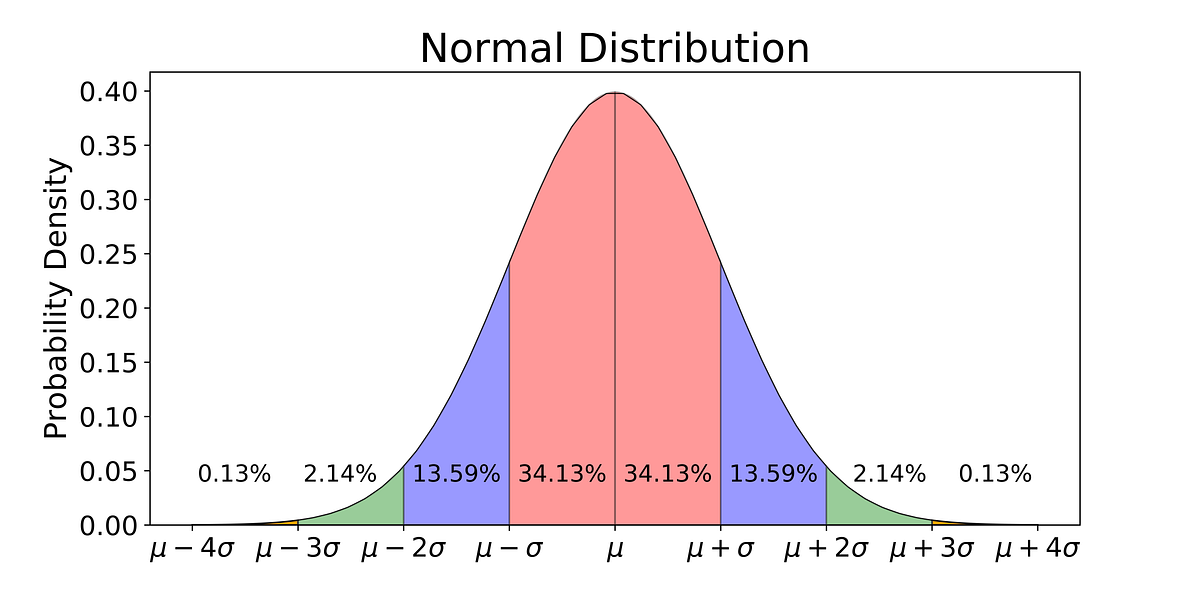
Normal Distribution
The normal distribution is also known as Gaussian Distribution. It is a bell-shaped curve with its mean value at the center. Most of the things in this world are normally distributed.
Normalization
Normalization is a technique often applied as part of data preparation for machine learning. The goal of normalization is to change the values of numeric columns in the dataset to use a common scale, without distorting differences in the ranges of values or losing information.
O
Outliers
In statistics, an outlier is a data point that differs significantly from other observations. We can also think of it as an exception or some random noise entry. We could either remove the outliers or if we are not allowed to do that, we proceed with normalizing the data.
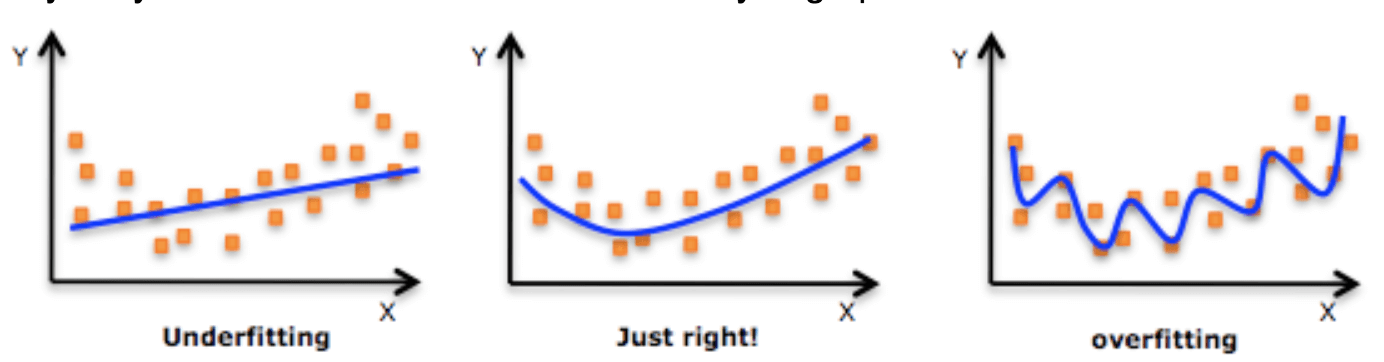
Overfitting
Overfitting is a concept in data science, which occurs when a statistical model fits exactly against its training data. When the model memorizes the noise and fits too closely to the training set, the model becomes “overfitted,” and it is unable to generalize well to new data. The training loss is very low in overfitted models but the test loss is very high.
Oversampling
When our data is imbalanced, we try to balance it using a technique called oversampling in which we randomly make duplicates of the minority class and make its proportion somehow close to the majority class.
P
p-value
In null hypothesis significance testing, the p-value is the probability of obtaining test results at least as extreme as the results actually observed, under the assumption that the null hypothesis is correct. If the p-value is less than 5% then we have strong evidence against the Null hypothesis and we can reject it.
Parameters
Parameters are the variables that we do not set while training a Neural Network. The most common examples are Weights and Biases.
Part of Speech Tagging
A POS tag (or part-of-speech tag) is a special label assigned to each token (word) in a text corpus to indicate the part of speech and often also other grammatical categories such as tense, number (plural/singular), case, etc. POS tags are used in corpus searches and in text analysis tools and algorithms.
Percentiles
In statistics, a percentile is a score below which a given percentage of data in its frequency distribution falls or a score at or below which a given percentage falls. For example, the 50th percentile is the score below which or at or below which 50% of the data in the distribution may be found.
Pipelining
A machine learning pipeline is a way to codify and automate the workflow it takes to produce a machine learning model. Machine learning pipelines consist of multiple sequential steps that do everything from data extraction and preprocessing to model training and deployment.
In simple words, we can say that pipelining is putting many operations in sequence after one another to get some final results.
Pooling
Pooling is nothing but simply downsampling an image. A basic 2X2 filter with a stride of 2 can reduce 75% of the image data. Most of the times pooling is used after a convolution layer.
Population
The population is basically the statistical name of our huge dataset. We take out samples from this population to perform tests on it and infer something out of it.
Precision
Let’s consider 2 classes Yes and No. Precision tells that out of all predicted Yes, how many were real Yes.
Principal Component Analysis
Principal Component Analysis or PCA is a linear dimensionality reduction algorithm. Linear Regression plots a line of best fit in only one direction while PCA plots various orthogonal lines of best fit to the data to explain maximum possible variance.
Probability Distribution Function
The probability distribution function (PDF) is a statistical expression that defines a probability distribution for a continuous random variable. The area under the PDF graph is always 1. The probability distribution function is the integral of the probability density function.
Probability Mass Function
Probability Mass function (PMF) is a statistical expression that defines the probability (the likelihood of an outcome) for a discrete random variable (e.g., a stock or ETF) as opposed to a continuous random variable. It is just the discrete version of the PDF.
R
R Squared
The R-Squared method is used to check the performance of our regression model.
R-CNN
- They use Selective Search
- An extra region proposal network is required which porpoises 2000 regions.
- All those 2000 regions are then passed through a network for classification.
- That network uses CNN for feature extraction and SVM for classification.
- R-CNN is very slow due to that extra Region Proposal Network.
Random Forest
A random forest is a machine learning technique that’s used to solve regression and classification problems. It utilizes ensemble learning, which is a technique that combines many classifiers to provide solutions to complex problems. A random forest algorithm consists of many decision trees.

Random Variable
In probability and statistics, a random variable, random quantity is described informally as a variable whose values depend on outcomes of a random phenomenon.
Recall
Let’s consider 2 classes Yes and No. Recall tells that out of all actual Yes, how many were correctly predicted.
Recommender Systems
Recommender systems are machine learning systems that help users discover new products and services. Every time you shop online, a recommendation system is guiding you towards the most likely product you might purchase. Recommender systems are like salesmen who know, based on your history and preferences, what you like. The two most common types of recommender systems are:
- Content based filtering RS
- Collaborative filtering RS
Recurrent Neural Networks
A recurrent neural network is a type of artificial neural network commonly used in speech recognition and natural language processing. Recurrent neural networks recognize data’s sequential characteristics and use patterns to predict the next likely scenario.
Regression
In statistical modeling, regression analysis is a set of statistical processes for estimating the relationships between a dependent variable and one or more independent variables.
Reinforcement Learning
Reinforcement learning is a machine learning training method based on rewarding desired behaviors and/or punishing undesired ones. In general, a reinforcement learning agent is able to perceive and interpret its environment, take actions and learn through trial and error.
Ridge Regression(L2 regularization)
In Ridge regression, we add an extra term to our Cost Function which is Lambda * (Sum of Square of Absolute values of magnitudes of weights). In this we if any weight value becomes very high (overfitting happens in this case), our total cost also increases, and hence in this way we prevent our model from overfitting.
It is also called L2 regularization. We have one more type of regularization which is widely used and that is Lasso Regression or L1 regularization.
Root Mean Squared Error
- Subtract predicted values from target values and square them.
- Add up all of the values from Step 1.
- Take root of the value from Step 2.
- Divide Step 3 by the number of measurements.
S
Sample
In statistics and quantitative research methodology, a sample is a set of individuals or objects collected or selected from a statistical population by a defined procedure.
Sensitivity
Sensitivity (True Positive Rate) refers to the proportion of those who received a positive result on this test out of those who actually have the condition. In a diagnostic test, sensitivity is a measure of how well a test can identify true positives
Sentiment Analysis
Sentiment Analysis is a special type of analysis in which when we are given some text whether it be a review or a rating, we try to predict whether the person liked it or not. We can use Tf-IDF to implement this. It falls under Supervised lEarning algorithms because we need the labels while the training phase.
Segmentation
The basic idea behind segmentation is to divide images into different segments. In Computer Vision the goal is to recognize and understand what’s in the image at the pixel level. Mask R-CNN is a Convolutional Neural Network (CNN) and state-of-the-art in terms of image segmentation.
This variant of a Deep Neural Network detects objects in an image and generates a high-quality segmentation mask for each instance.

Simple Linear Regression
Like in Multiple regression, our dependent variable y is dependent on multiple independent variables x1, x2, x3, etc (y = m1x1+m2x2+m3x3+…), similarly, in Simple Linear regression, our dependent variable y is just dependent on 1 independent variable x (y = mx+c).
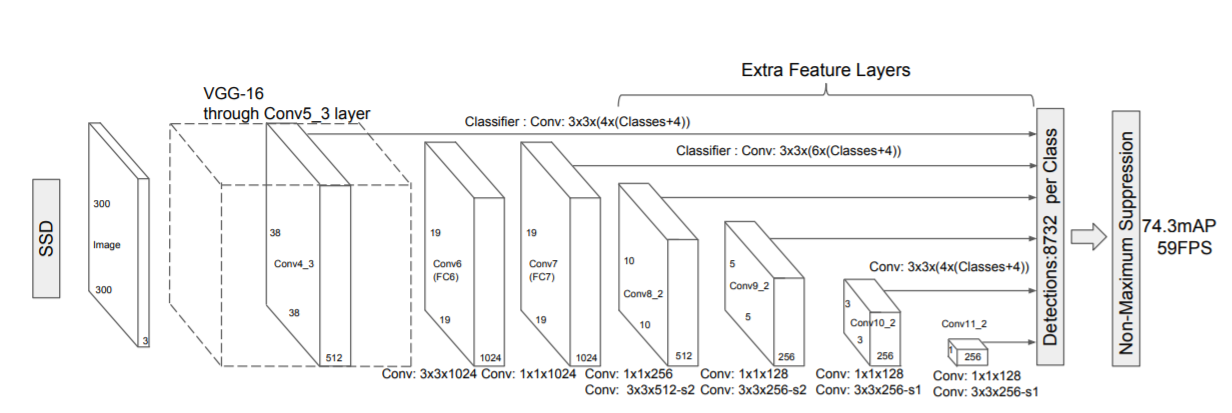
Single Shot Detection
A single shot detector like YOLO takes only one shot to detect multiple objects present in an image using a multi-box. It is significantly faster in speed and high-accuracy object detection algorithm. The high speed and accuracy of SSD using relatively low-resolution images are attributed due to the following reasons:
- Eliminates bounding box proposals like the ones used in RCNN’s
- Includes a progressively decreasing convolutional filter for predicting object categories and offsets in bounding box locations.
Specificity
Specificity (True Negative Rate) refers to the proportion of those who received a negative result on this test out of those who do not actually have the condition. Specificity is a measure of how well a test can identify true negatives.
Standard Deviation
Standard Deviation basically helps us to determine how much our data points have deviated from the mean. A low standard deviation indicates that the values tend to be close to the mean of the set, while a high standard deviation indicates that the values are spread out over a wider range.
Standardization
Standardization is an operation in which we transform our data in such a way that its mean becomes 0 and standard deviation becomes 1.
Supervised Learning
Supervised Learning is the most common type of learning used in Machine Learning. In supervised learning, we are given the labels/targets of the data. Some commonly used supervised learning algorithms are Linear Regression, Logistic Regression, KNN, Naive Bayes, Support Vector Machines, etc.
Support Vector Machines
Support Vector Machine or better known as SVM is a supervised binary classification algorithm. It basically tries to draw a hyperplane between the two classes, so as to maximize the margins between them as much as possible. Whenever a new data point comes it sees that on which side of the hyperplane is the data point falling and according to that it assigns it a class.
T
Tensor
Tensor is just a fancy name for a multidimensional vector.
Term Frequency
Term Frequency is simply the number of times that term/word is occurring in the document.
Tokenization
Tokenization is a very important operation used in NLP. It just splits a sentence into a list of words. For eg., the sentence is ‘I am a good boy’, when we tokenize this sentence it becomes [‘I’, ‘am’, ‘a’, ‘ good’, ‘boy’].
U
Underfitting
Underfitting is a scenario in data science where a data model is unable to capture the relationship between the input and output variables accurately, generating a high error rate on both the training set and test set.
Undersampling
When our data is imbalanced, we try to balance it using a technique called undersampling in which we randomly delete data points of the majority class and make its proportion somehow close to the minority class.
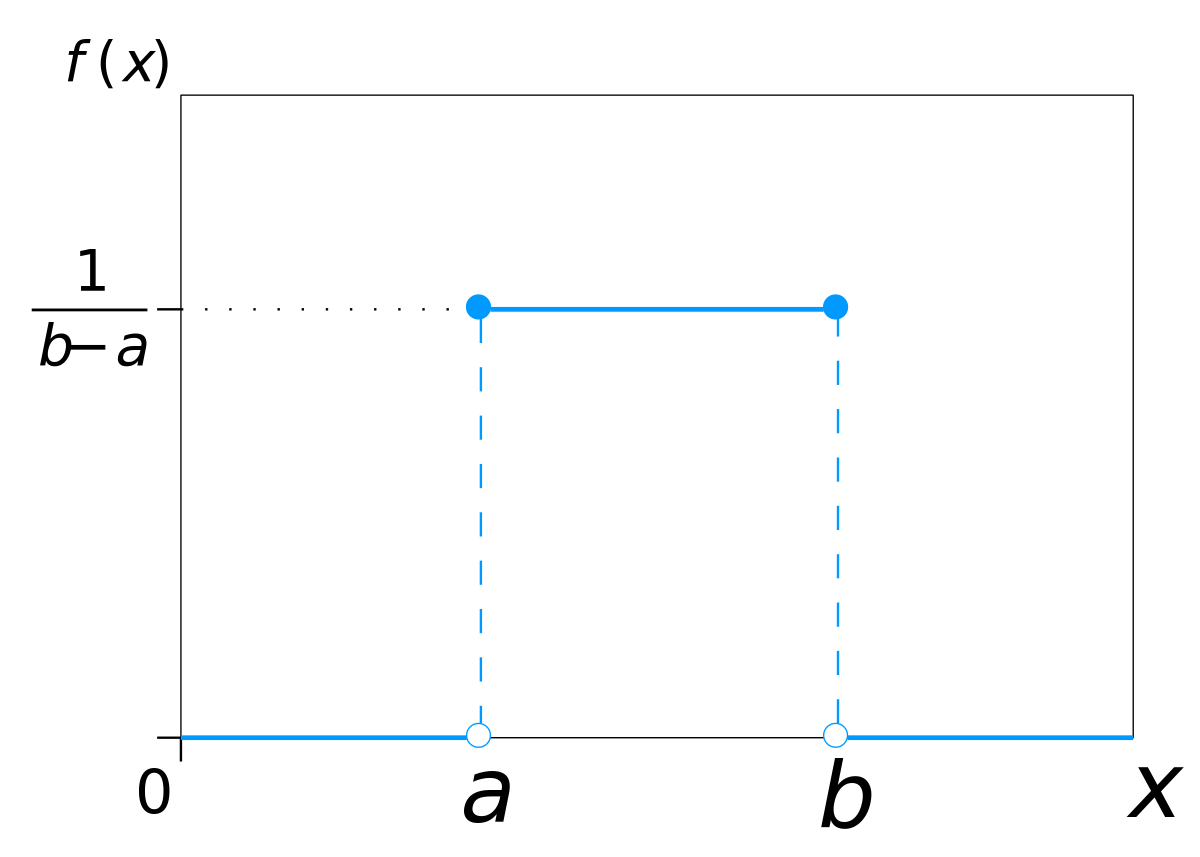
Uniform Distribution
Uniform distribution is a symmetric probability distribution in which every data point is having the same probability of being picked out. One thing to note here is that we are provided with a range like 0 to 1 or -1 to +1 from which we pick our points.
Univariate
Univariate analysis is the simplest form of analyzing data. “Uni” means “one”, so in other words, your data has only one variable. It doesn’t deal with causes or relationships (unlike regression ) and its major purpose is to describe; It takes data, summarizes that data, and finds patterns in the data.
Unsupervised Learning
Unsupervised learning refers to the use of artificial intelligence (AI) algorithms to identify patterns in data sets containing data points that are neither classified nor labeled. Some examples are PCA, KMeans Clustering, DBSCAN clustering, etc.
V
Vanishing Gradient
Vanishing gradient is a problem that appears in very deep neural networks. As the name suggests, in this problem very small values (<1) keep on multiplying with each other during the backpropagation phase while updating the weights and biases, and in the initial layers of the network these values become almost 0, that’s why it is said vanishing gradient.
Variance
Variance is a measure of dispersion, meaning it is a measure of how far a set of numbers is spread out from their average value.
X
XGBoost
XGBoost(Extreme Gradient Boosting) is an implementation of gradient boosted decision trees designed for speed and performance. Some of the main features of XGBoost are:
- Parallelization of tree construction using all of your CPU cores during training.
- Distributed Computing for training very large models using a cluster of machines.
- Out-of-Core Computing for very large datasets that don’t fit into memory.
- Cache Optimization of data structures and algorithm to make best use of hardware.
Y
YOLO
You only look once (YOLO) is a state-of-the-art, real-time object detection system. It works on the darknet framework which is a specially arranged network of Convolutional Layers and Max Pooling Layers. It is a type of Single Shot Detector as it detects objects in an image in a single shot using multi boxes.
Z
Z-score
Z-score (also called a standard score) gives you an idea of how far from the mean a data point is. But more technically it’s a measure of how many standard deviations below or above the population mean a raw score is.
Check out my other machine learning projects, deep learning projects, computer vision projects, NLP projects, Flask projects at machinelearningprojects.net